











Monitor Platform
The Monitor Platform is a monitoring product from OpsAny built on Zabbix. It provides rich data collection capabilities and is designed to meet the requirements of different monitoring scenarios, improving the timeliness, accuracy, and intelligence of monitoring so that business systems keep running properly.
Tip
OpsAny basic monitoring is not intended to be a thin shell around Zabbix. Its main purpose is to effectively integrate the Resource Platform (CMDB), the Control Platform (onboarding), and Zabbix. Therefore, monitor templates, alerts, and similar items are still managed in Zabbix.
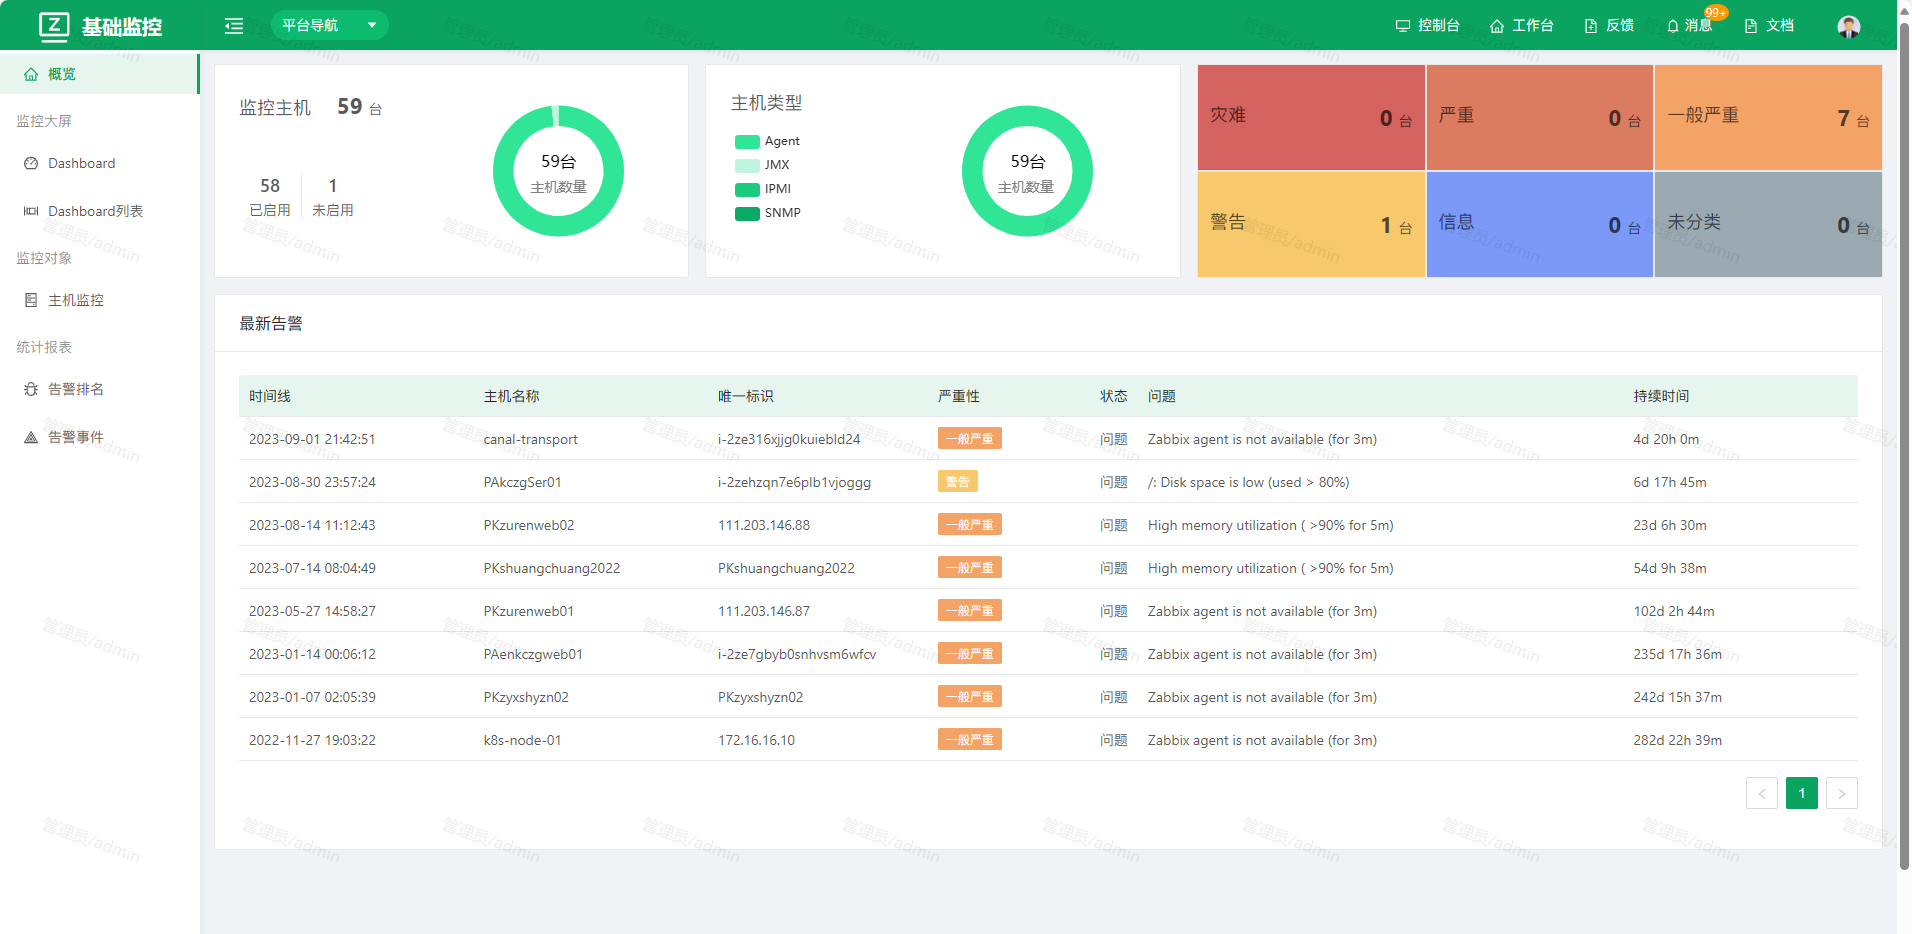
- Closed loop: integrates CMDB, the event center, the log platform, the Job Platform, and tickets to make monitoring more intelligent.
- Alerts: policies cover single-host, single-instance, cluster, and multi-dimensional alerting requirements.
- Zabbix management: monitor templates and alerts are still managed in Zabbix.
1. Monitoring Dashboard
The monitoring dashboard presents business health through dashboards, mainly using Zabbix and Grafana. You can customize dashboards and set alert thresholds. Monitoring measures standards from different analytical angles, such as metrics and dimensions.
1.1 Dashboard
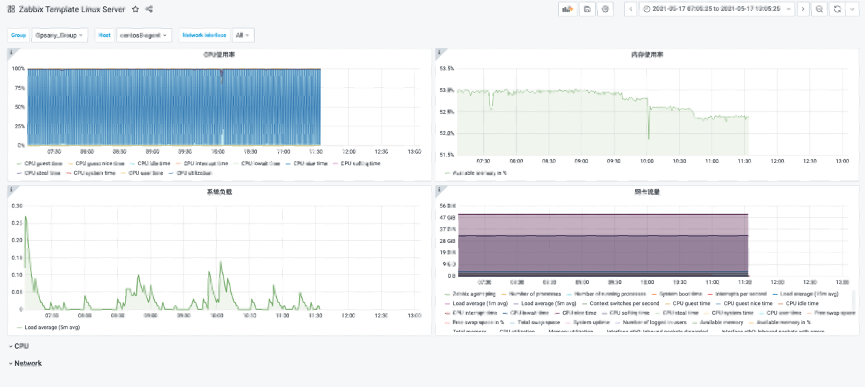
The Dashboard helps you monitor data visually, so you can track specified metrics and dimensions more intuitively.
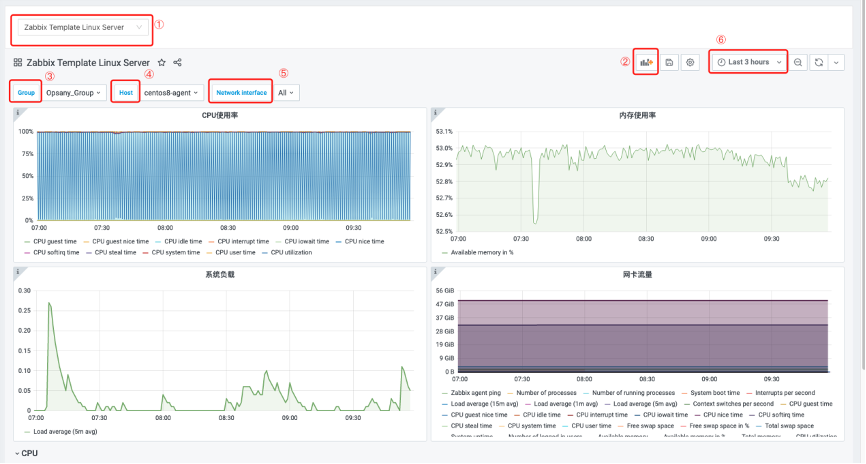
- Click the drop-down list in the upper-left corner to switch between dashboards.
- To create a view, you can select the data first or the view first.
- You can display dashboard content by group.
- You can display dashboard content by host.
- You can display content by network.
- You can view specific content by time range.
1.2 Dashboard List
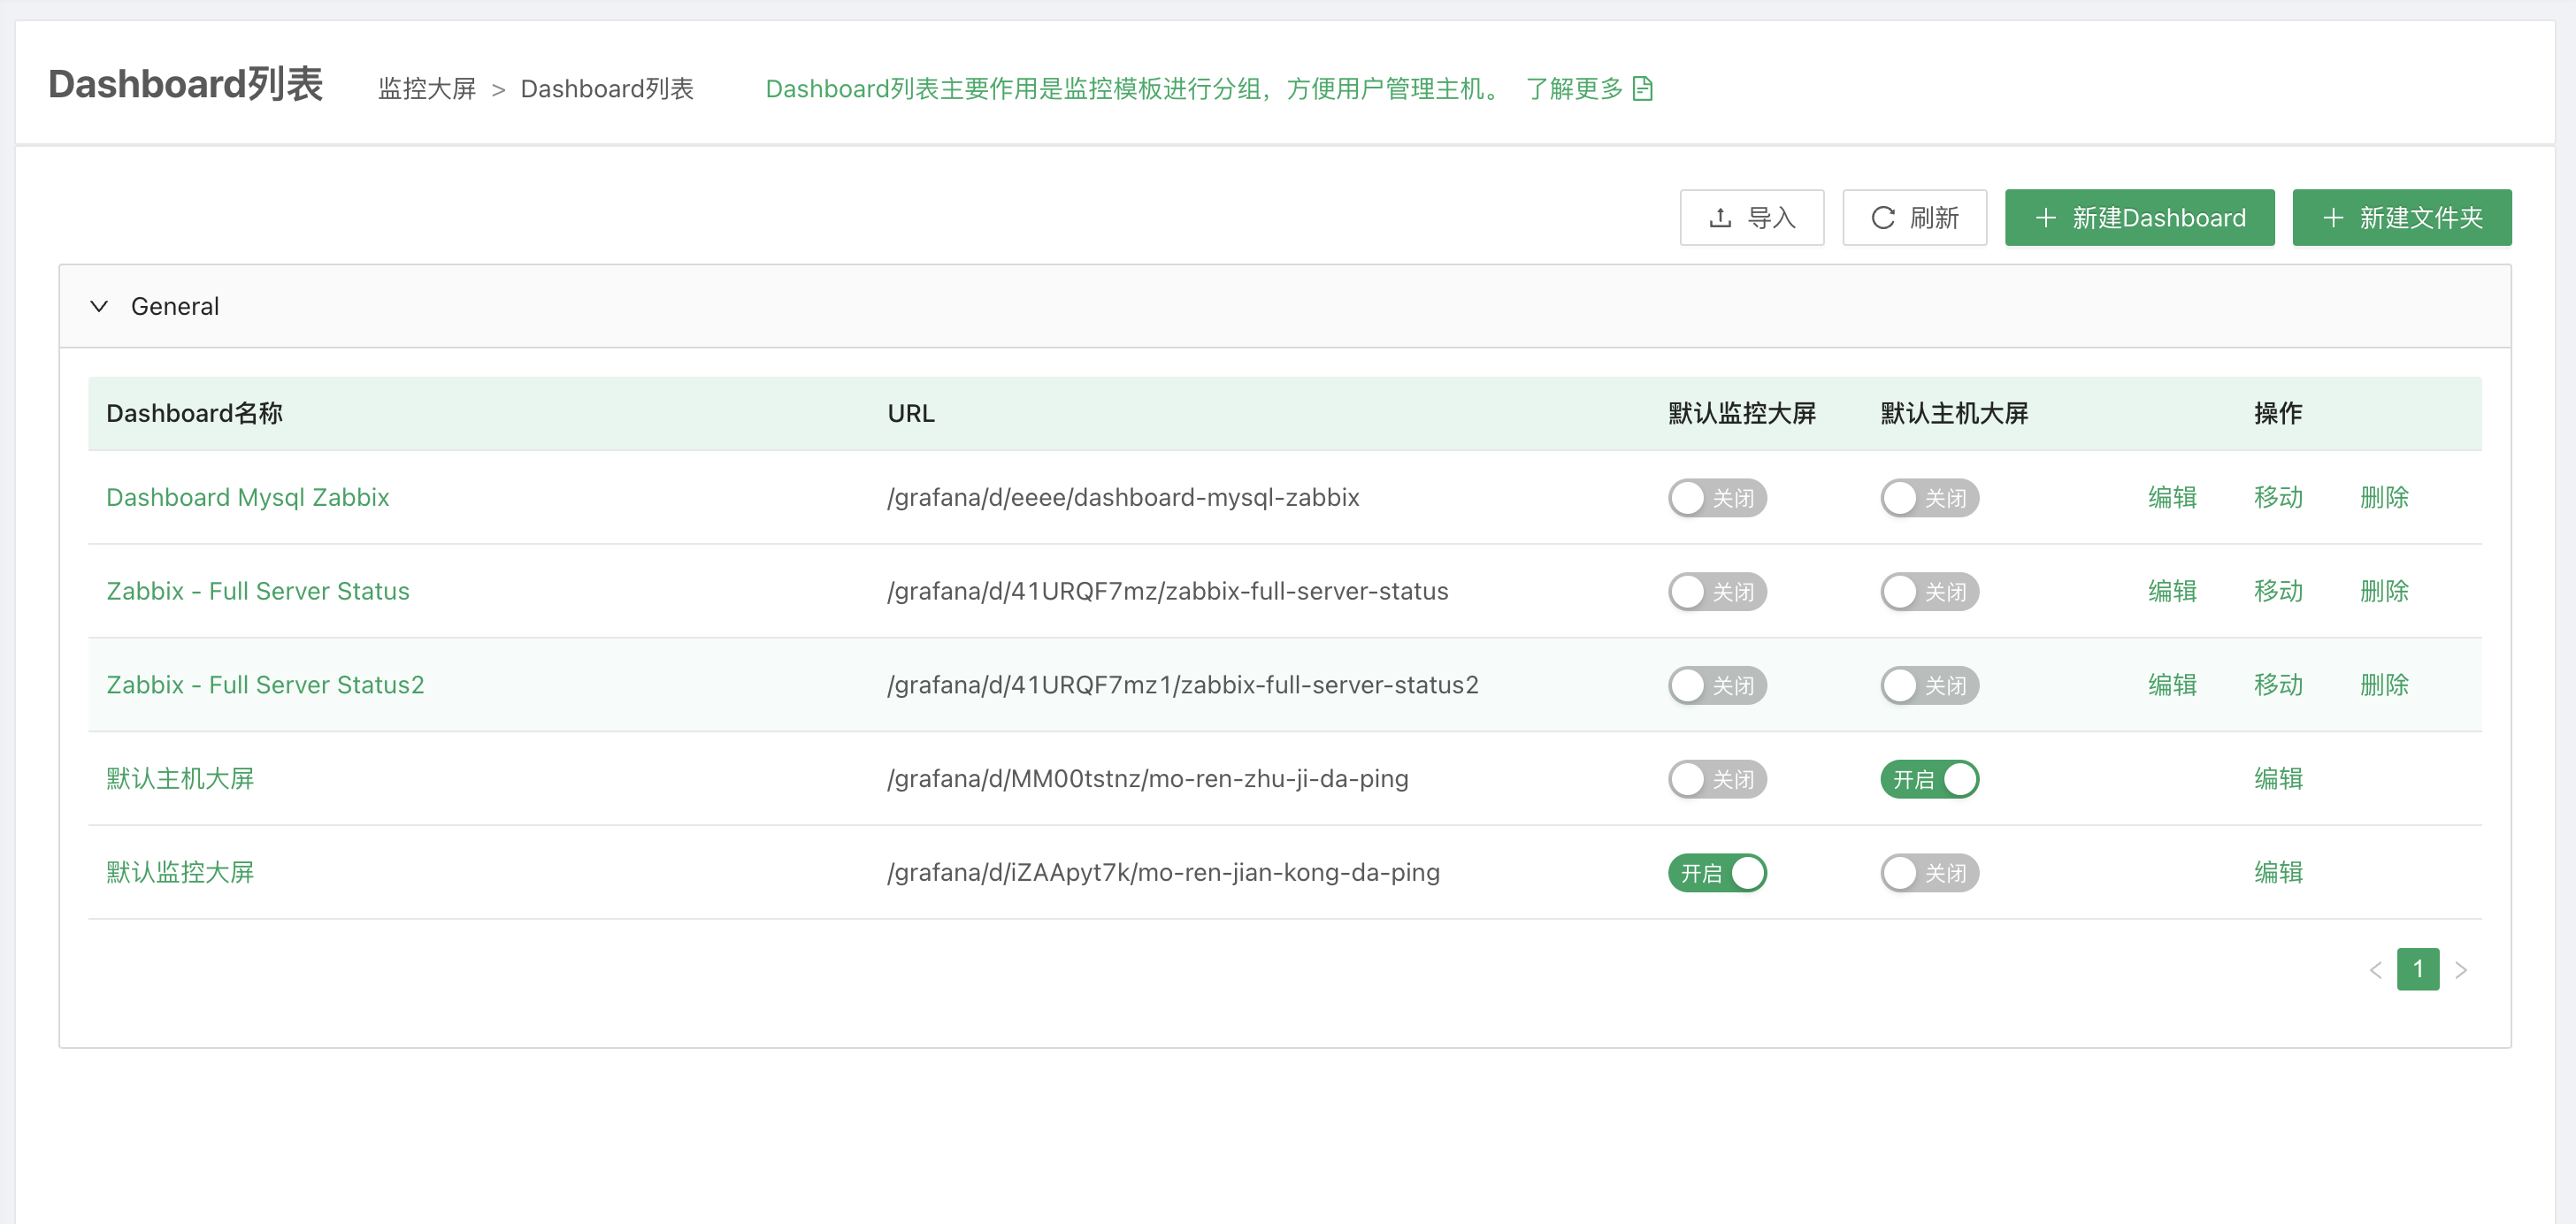
You can download dashboards from Grafana and import them into the dashboard list.
The dashboard list is mainly used to group monitor templates, making it easier to manage hosts.
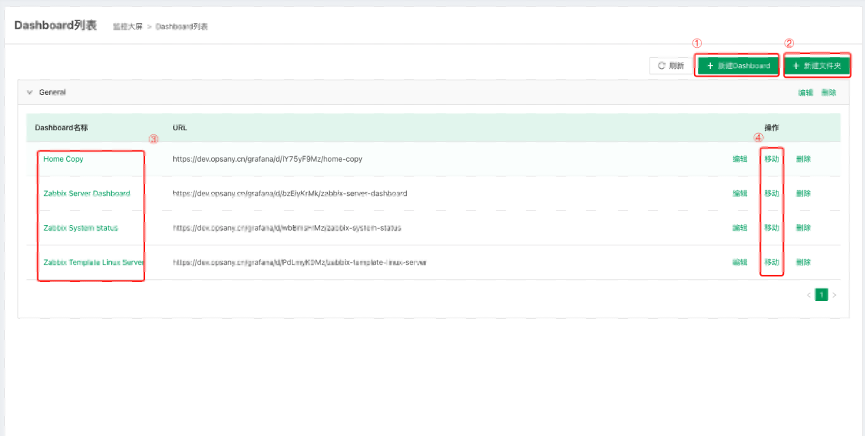
Click New Dashboard to open the new dashboard page
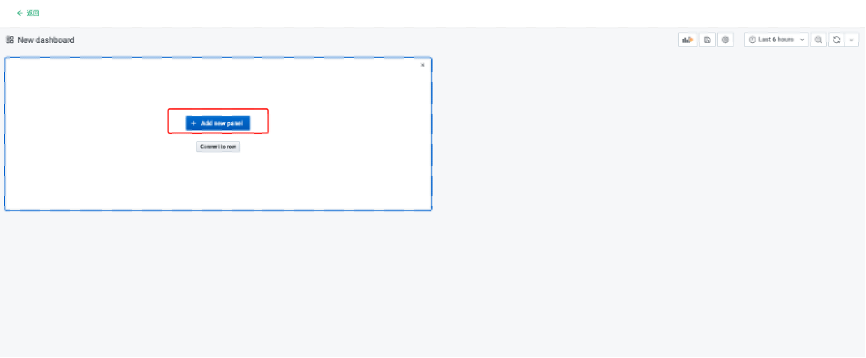
Click add new panel to open the panel creation page
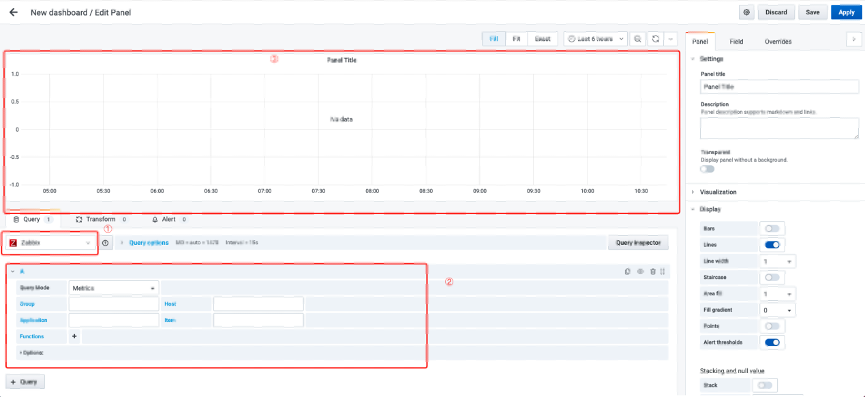
- Select the data source. The Monitor Platform uses Zabbix as the default monitoring data source.
- Select the data objects to monitor and set the monitoring frequency and other fields.
- After these two selections, a monitoring dashboard is generated.
Click New Folder
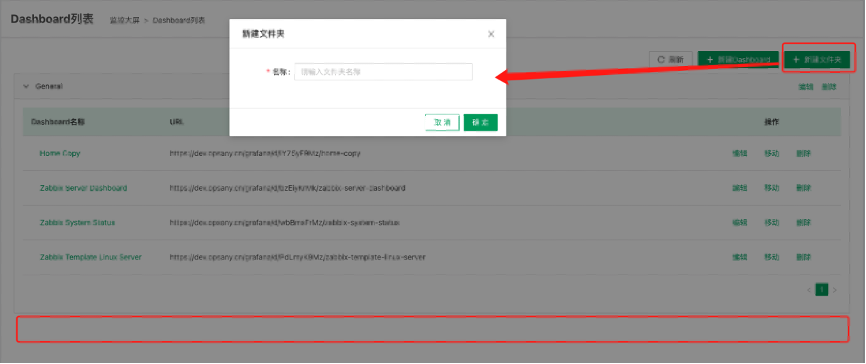
Folders help you manage monitor templates and group related templates.
- Click a template name to view its monitoring details.
- Click the Move button to move the current template to another group.
2. Monitoring Objects
Monitoring objects center on all host data. Host data comes from the Control Platform. If the Control Platform has no hosts, host monitoring data is also empty. Therefore, you must first add the Zabbix monitoring plugin to hosts that are not yet monitored on the Control Platform - Host Management page; the hosts are then synchronized automatically to basic monitoring.
2.1 Host Monitoring
Host monitoring shows the monitoring objects and data of the corresponding host.
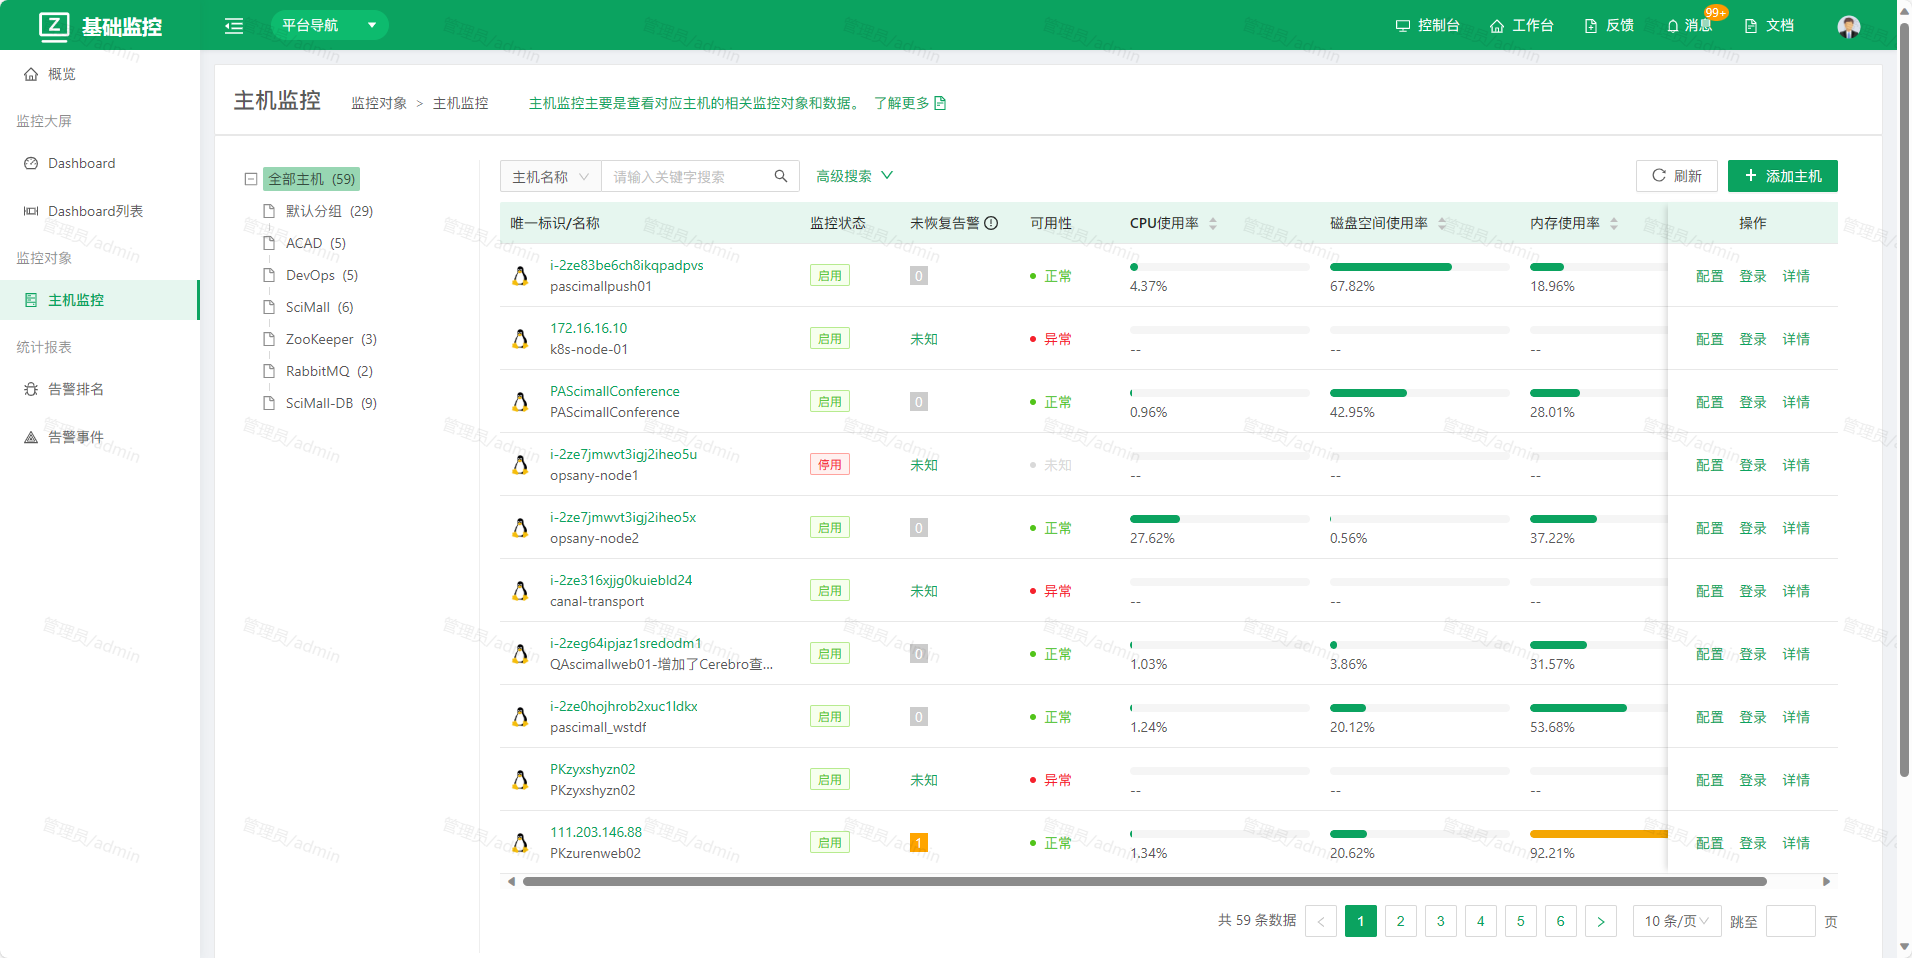
- The groups here follow the host groups of the Control Platform, making it easier to manage host resources.
- Clicking Add Host in the upper-right corner of the page takes you to the Control Platform. There, on the Control Platform - Host Management page, add the Zabbix monitoring plugin to hosts that are not yet monitored, and they are synchronized automatically to basic monitoring.
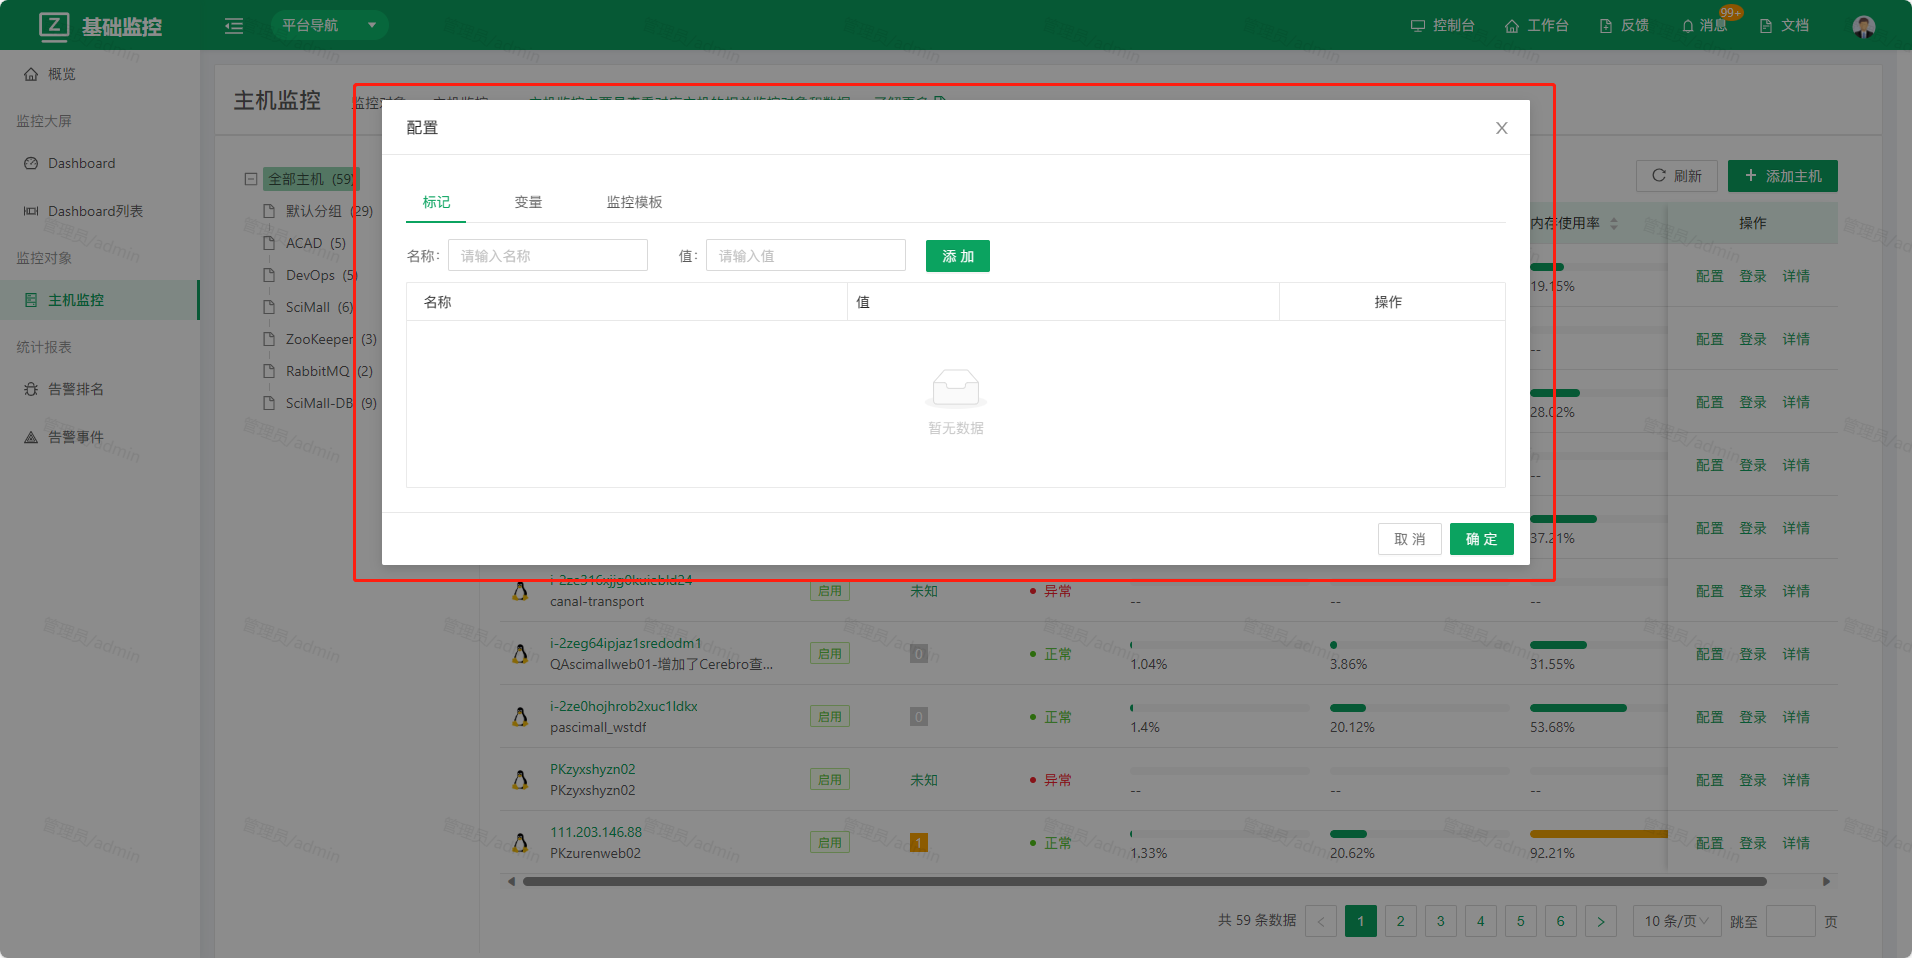
- Click Configure to add tags, variables, and monitor templates to the target host.
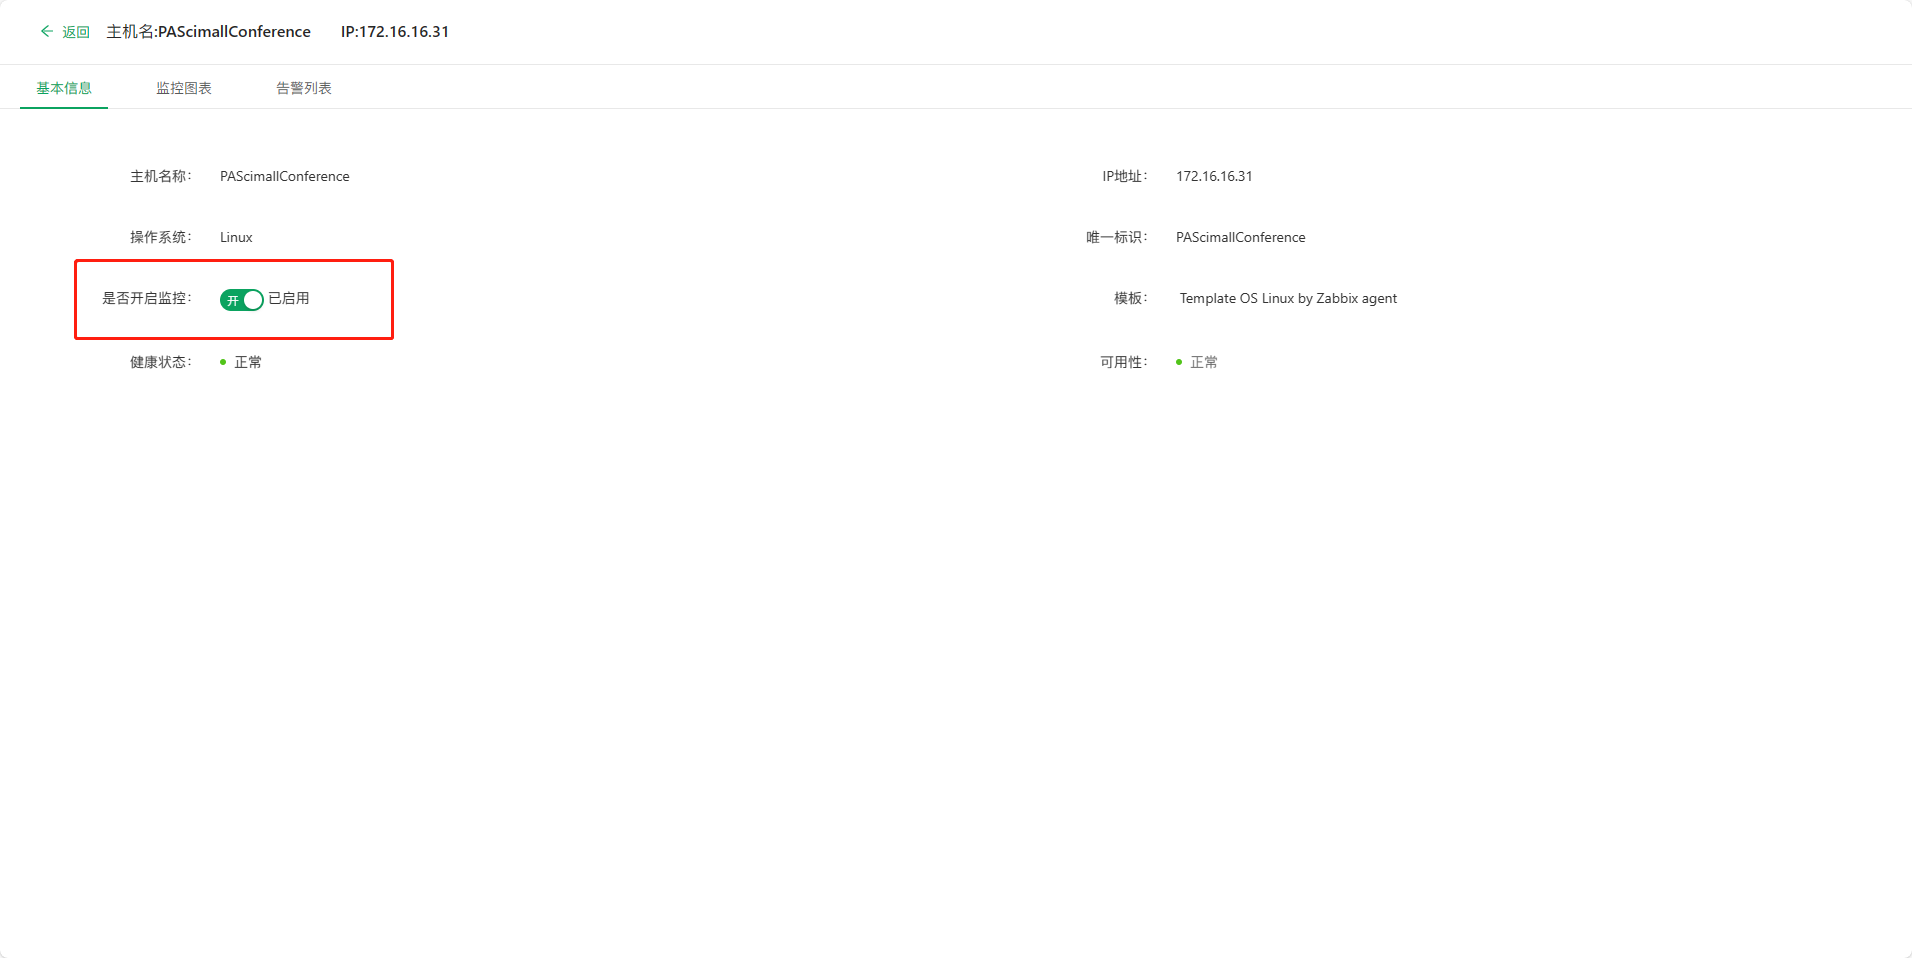
- Click View Details to see the host's basic information, monitoring charts, alert list, and other information on the host details page.
- You can choose whether to enable monitoring for the target host.
2.2 Network Devices
Network devices are monitored and reviewed for metrics such as those of switches and routers.
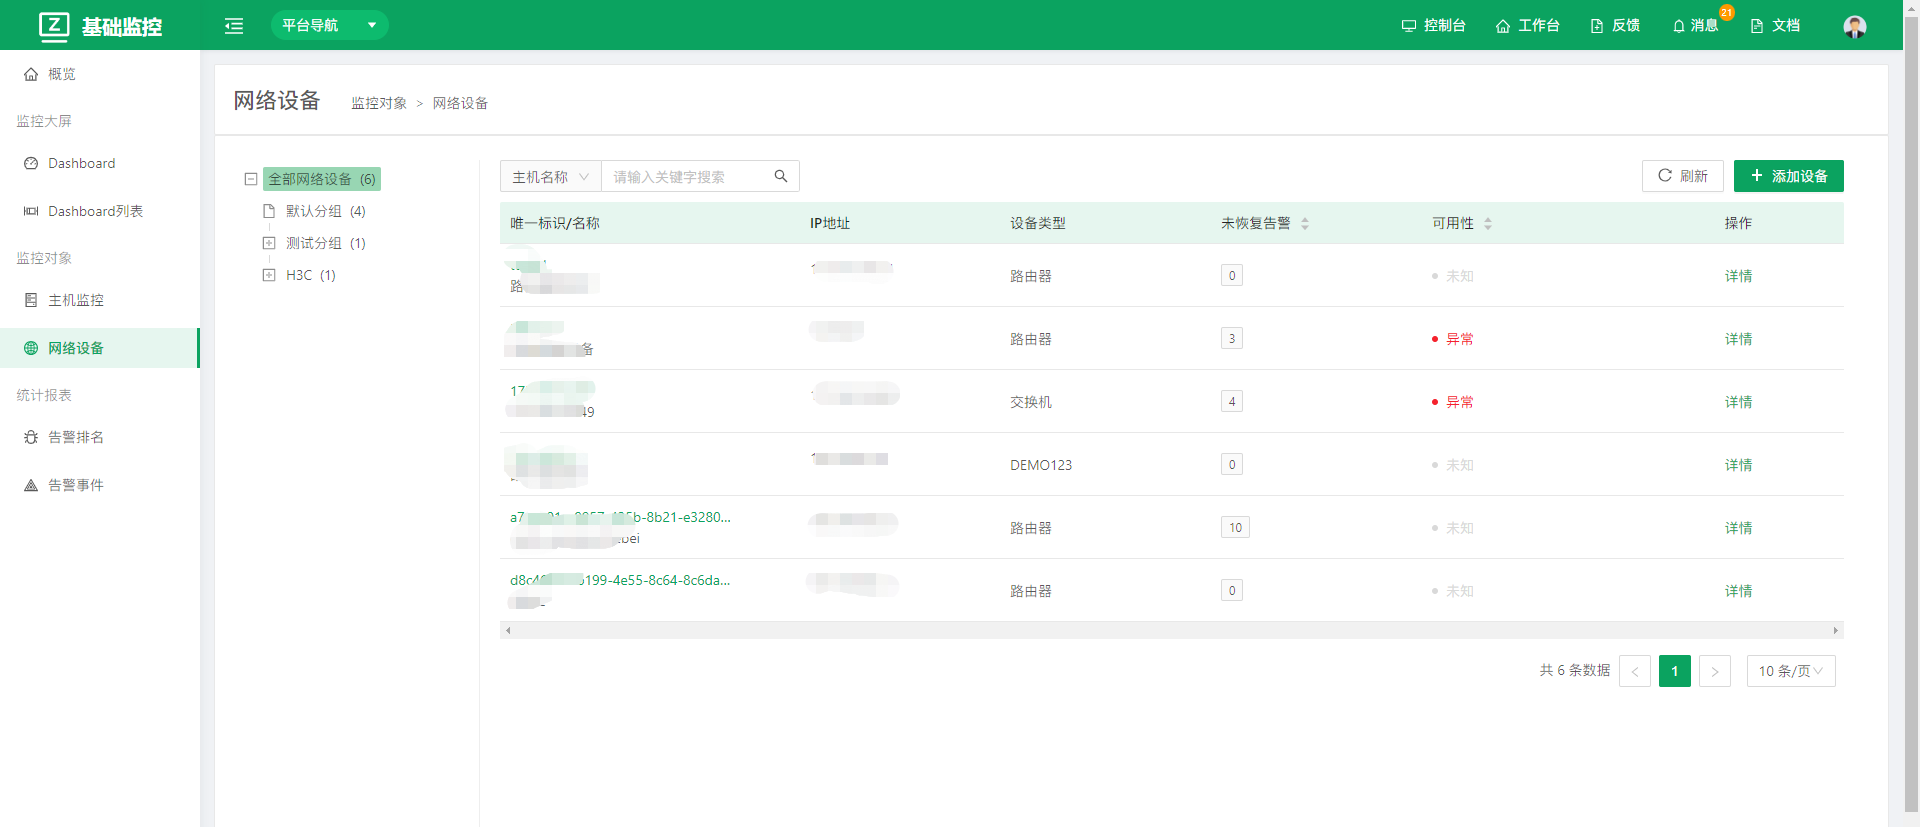
- The groups here follow the network device groups of the Control Platform, making it easier to manage network device resources.
-
Clicking Add Device in the upper-right corner of the page takes you to the Control Platform. There, on the Control Platform - Network Devices page, add a device manually or add a device from the Resource Platform, then select the Zabbix monitoring plugin data to synchronize automatically to basic monitoring.
-
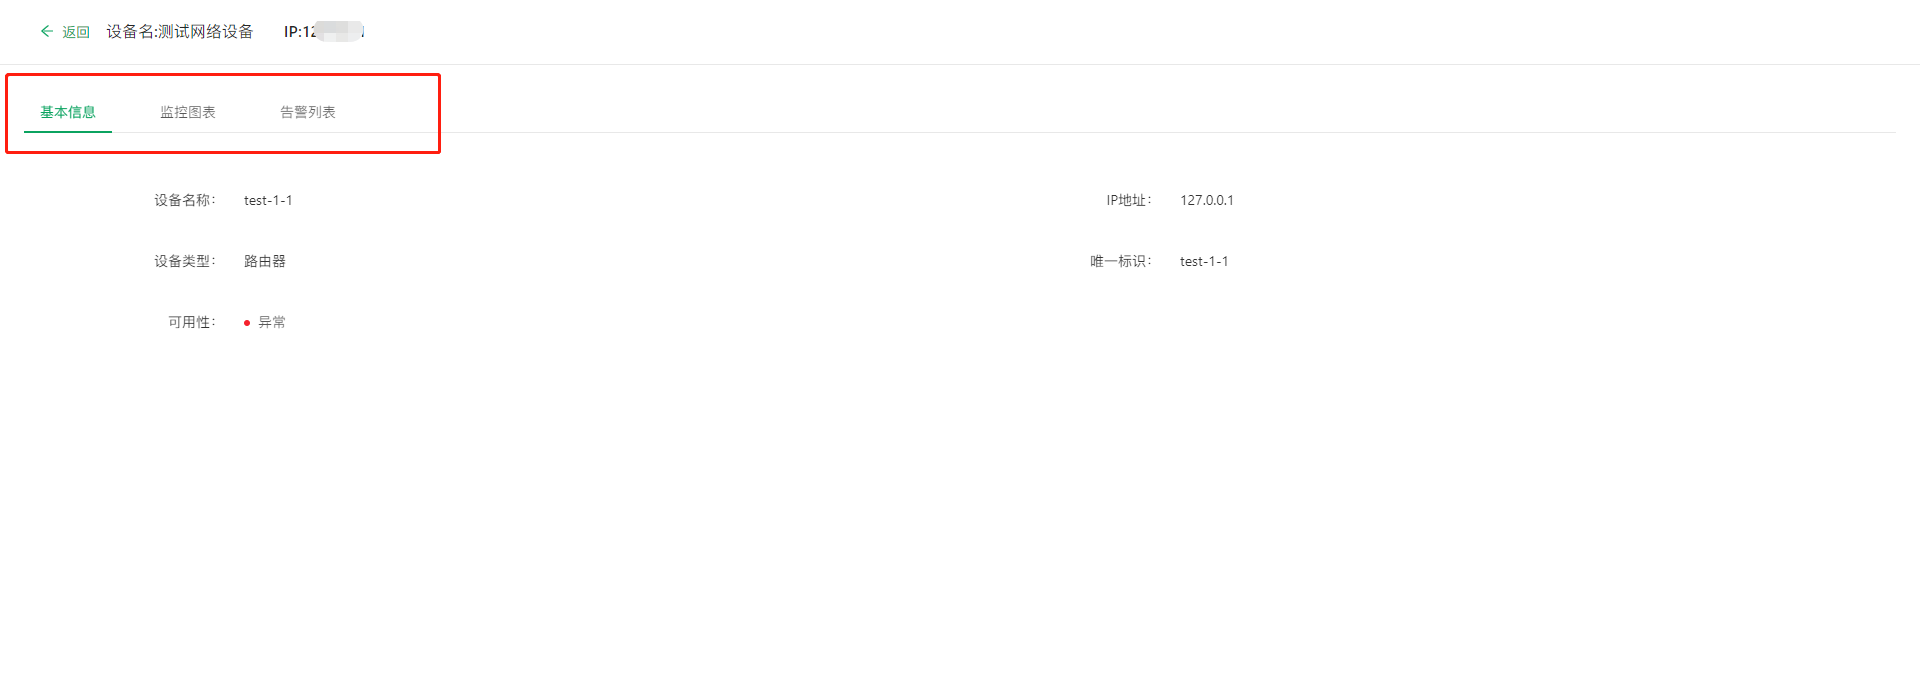
Click Details in the list to open the network device monitoring details page, where you can view the device's basic information, monitoring charts, alert list, and other information.
3. Report Statistics
3.1 Alert Ranking
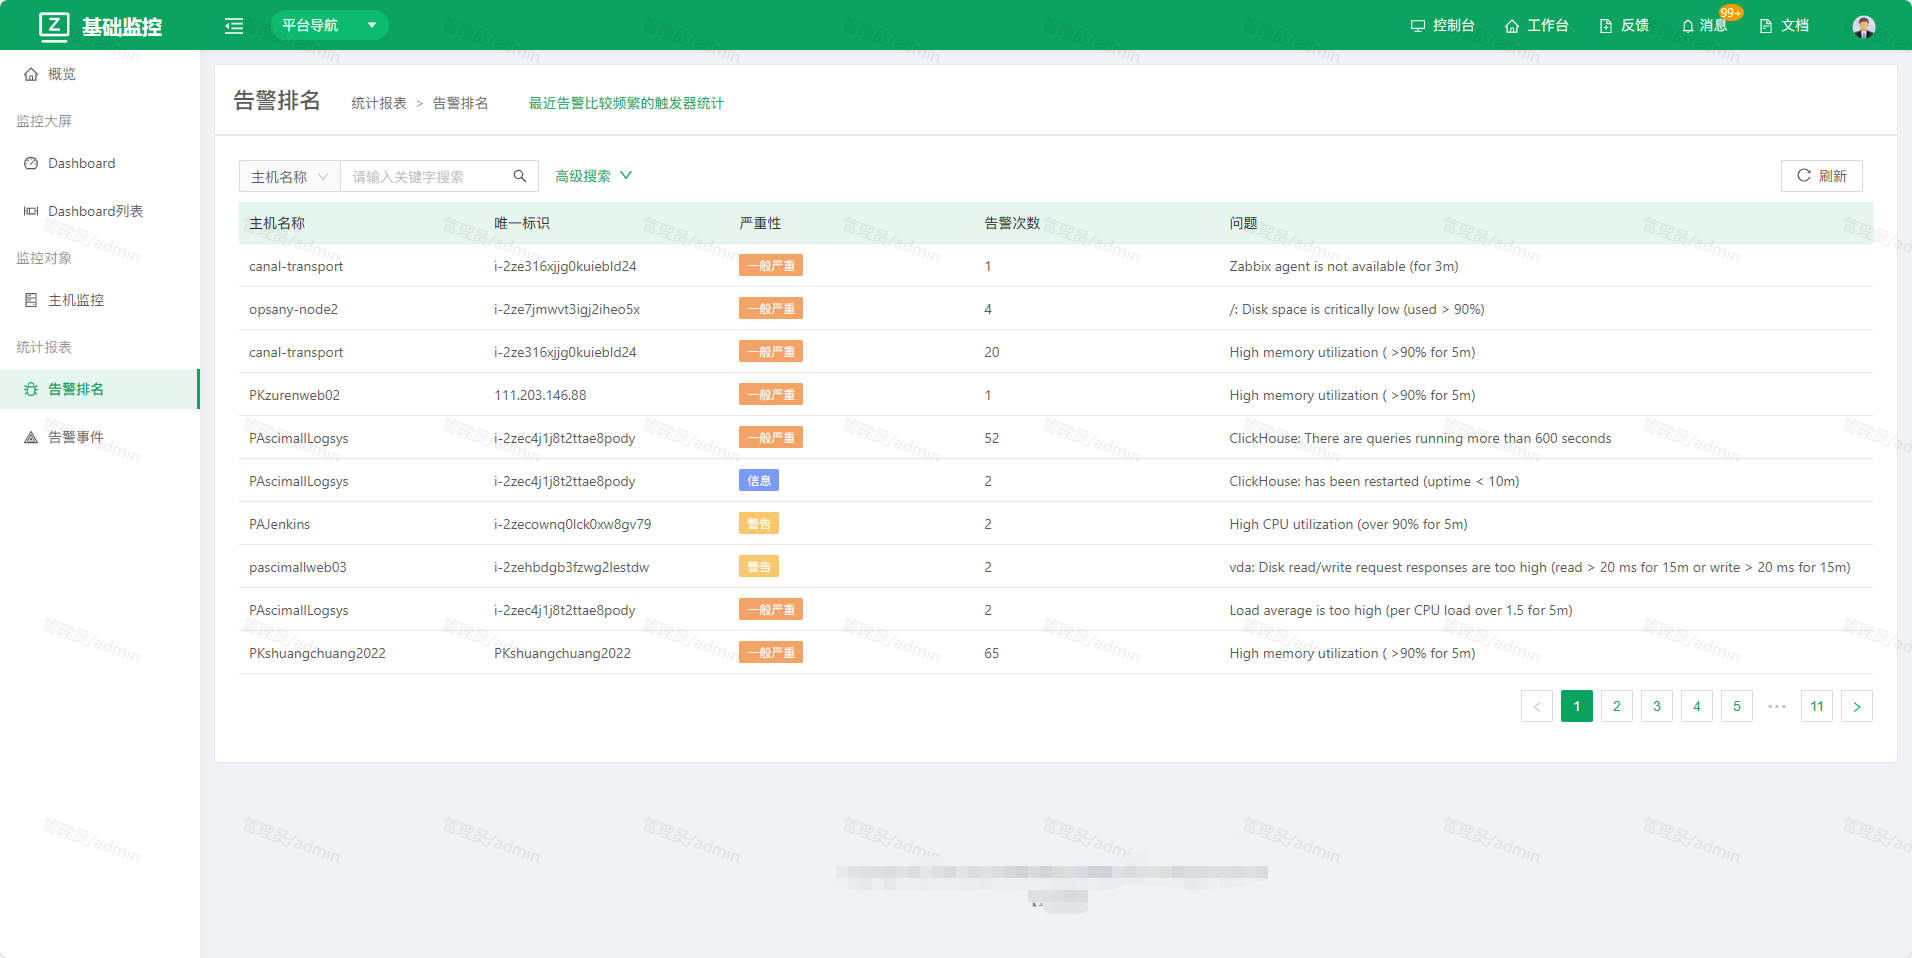
Alert ranking shows statistics on triggers that have alerted most frequently recently.
3.2 Alert Events
Alert events show alert event records that are currently firing and not yet resolved.
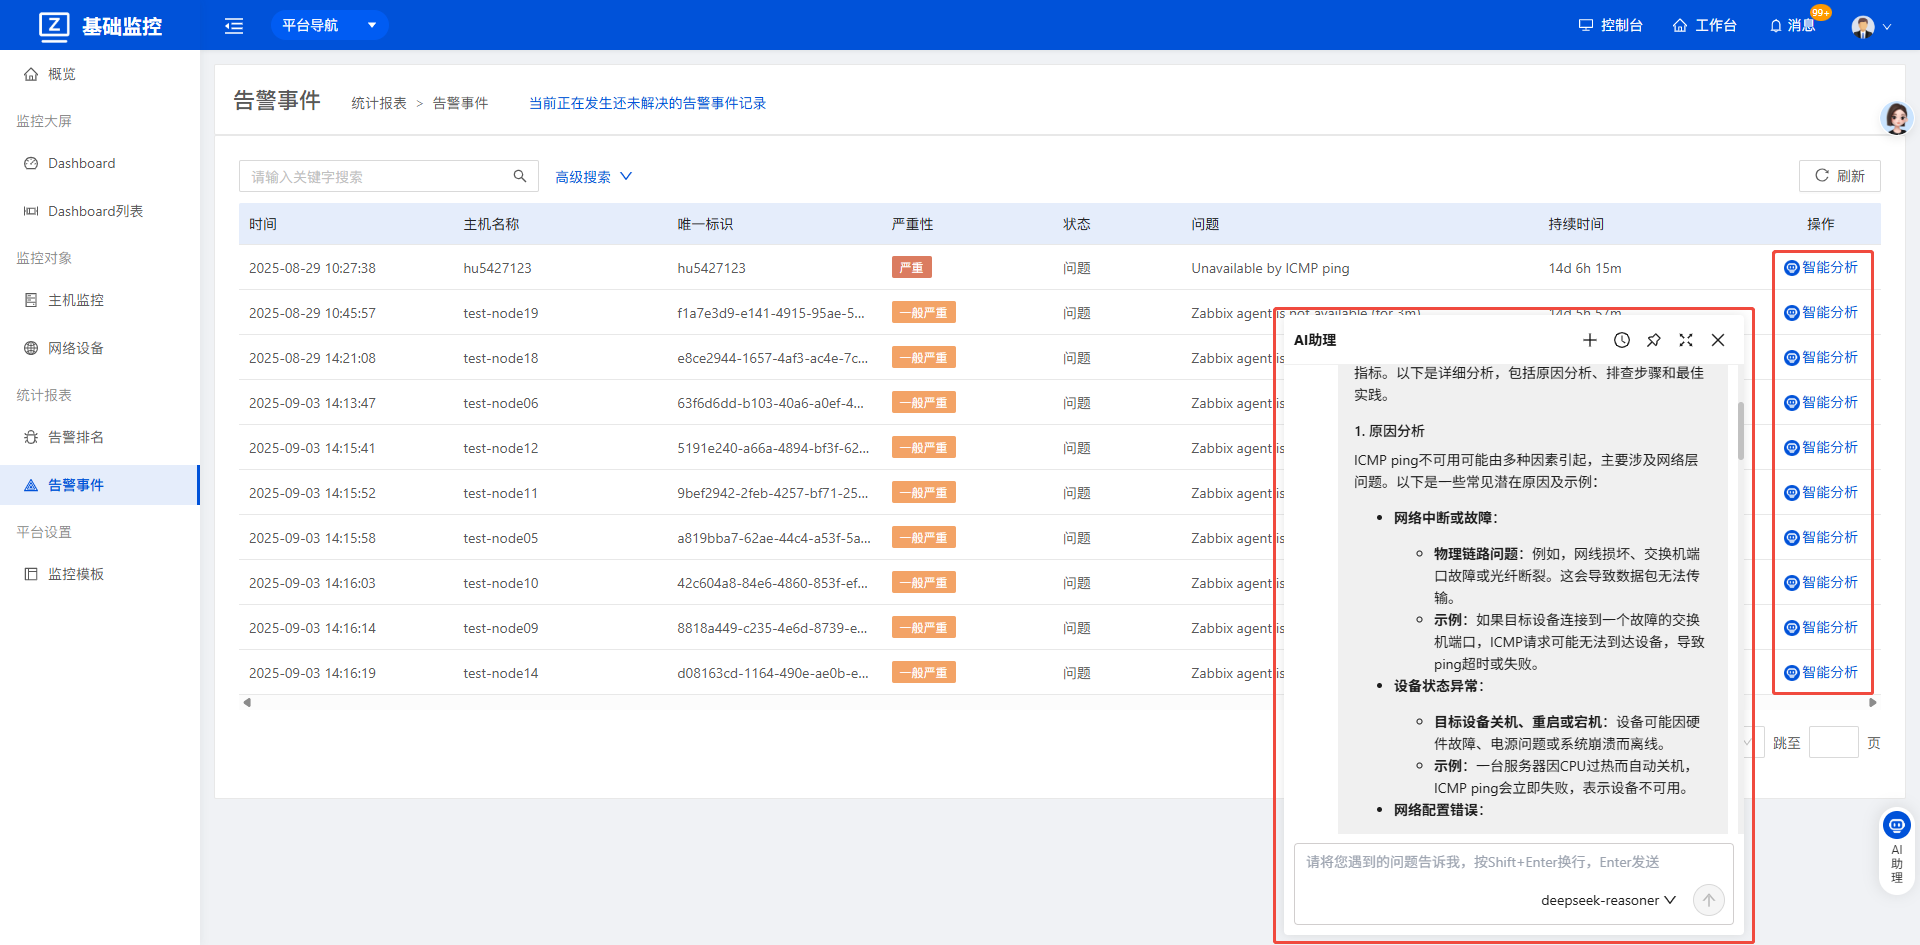 The page adds AI analysis, which uses the AI assistant to analyze firing alert events and provide details such as the cause, troubleshooting methods, and best practices.
4. Platform Settings
4.1 Monitor Templates
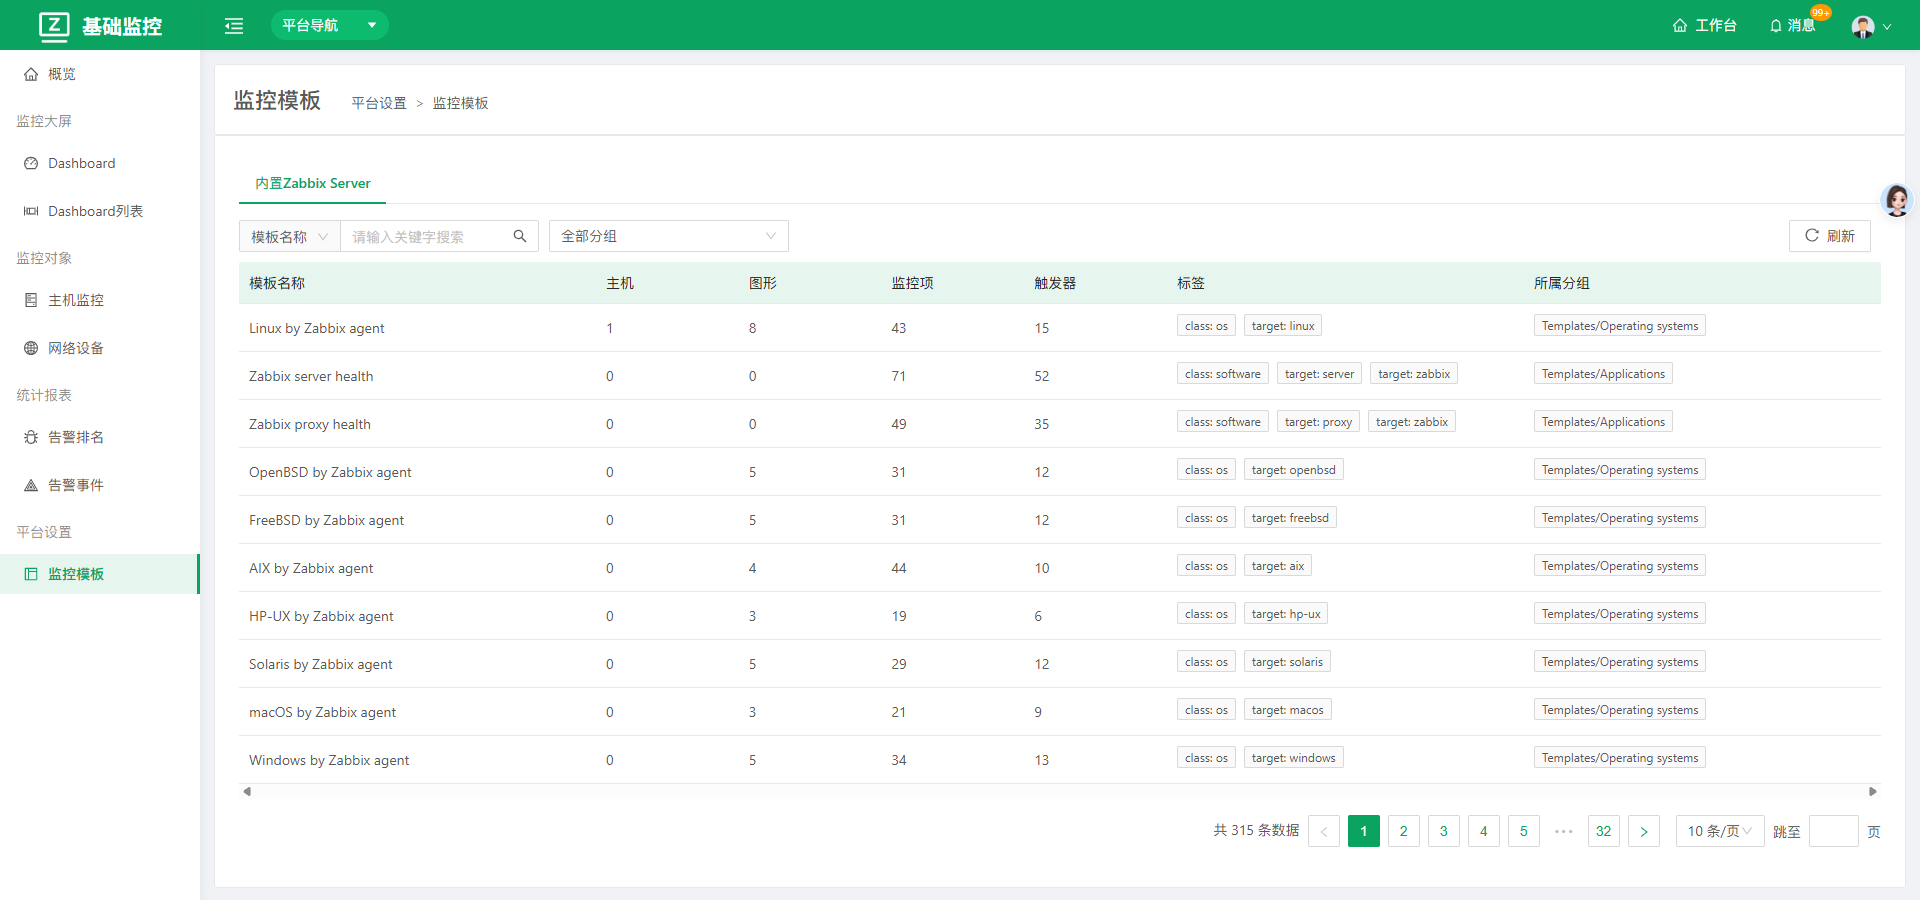
Shows the list of monitor templates integrated from Zabbix.
Info
Open source technology statement: OpsAny actively embraces open source technology and encourages everyone to protect the intellectual property of open source technology and use it lawfully. The Monitor Platform uses the following open source technologies.
- Zabbix: https://github.com/zabbix/zabbix
- Prometheus: https://github.com/prometheus/prometheus