












Control Platform
The Control Platform is OpsAny's underlying resource onboarding and control system, and the connector between the OpsAny system and your resources. It supports a hybrid of Agent and SSH connections and common Linux and Windows operating systems, and provides remote execution, file distribution, and data collection as three atomic operations for other platforms. The Control Platform is the foundation of all other operations management: only after resources are onboarded can related management operations be performed.
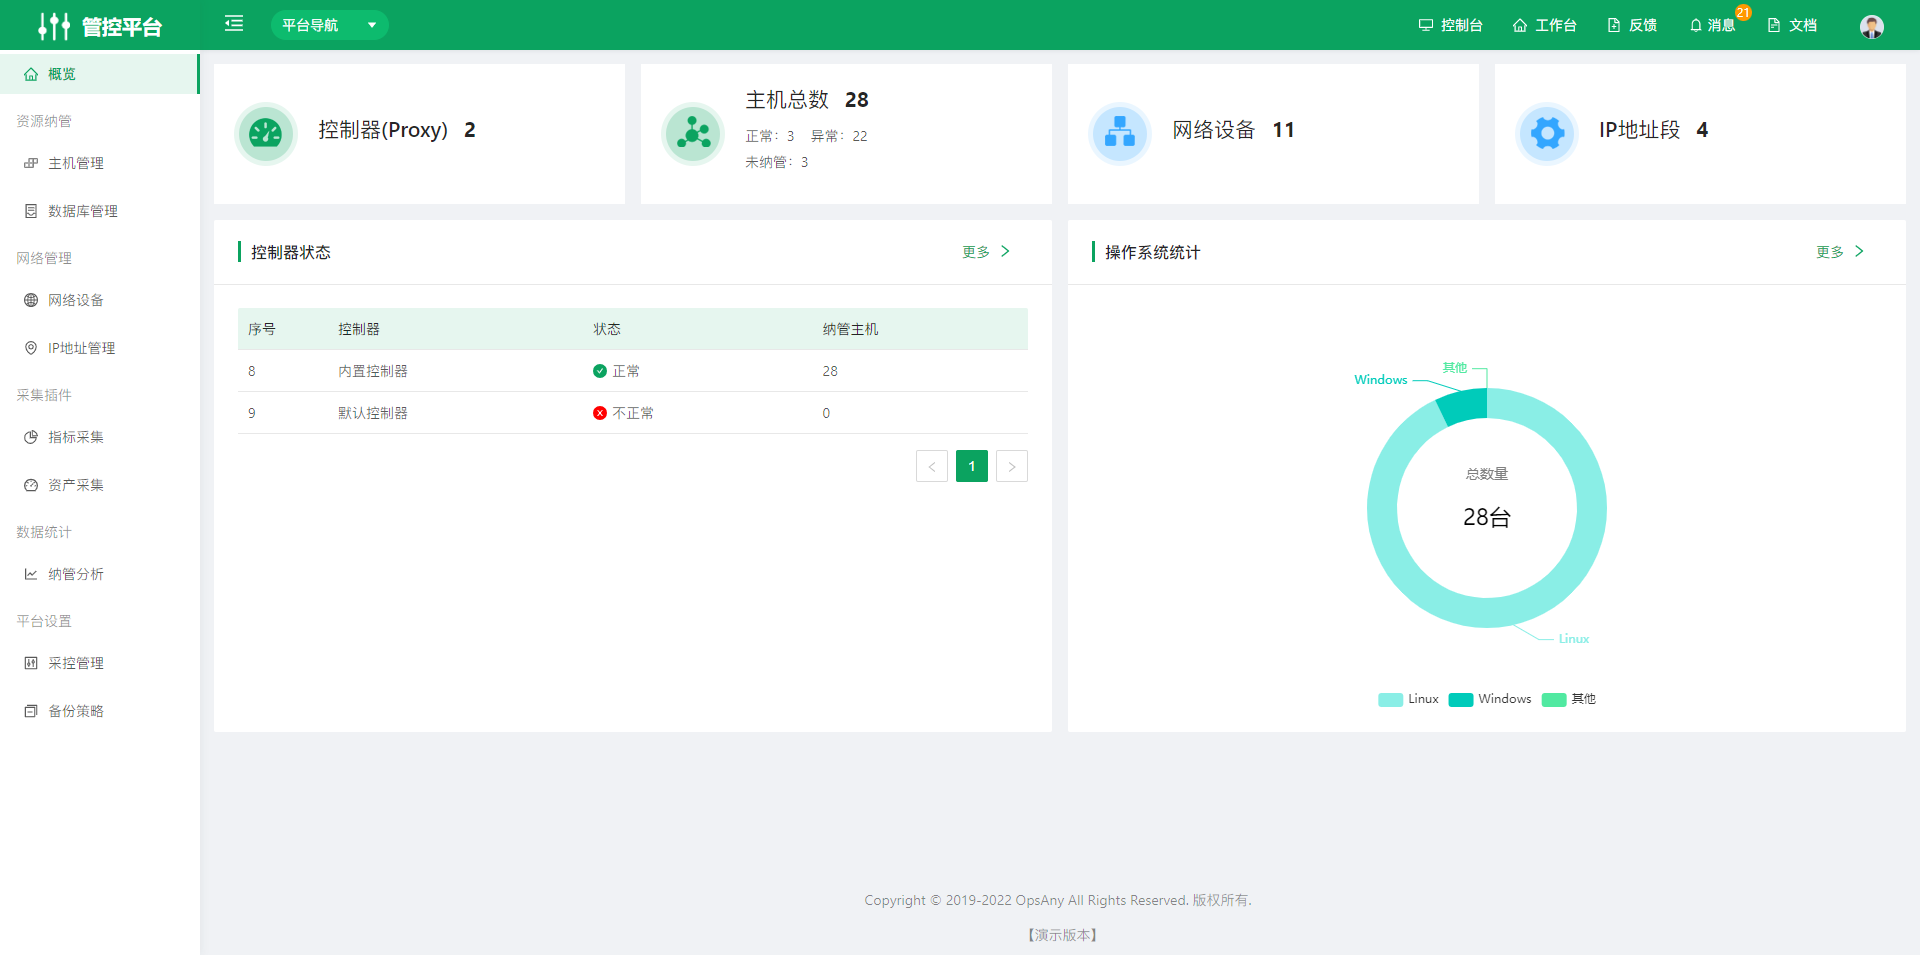
1. Resource Onboarding
Host Management helps users store and synchronize host data in the Control Platform, manage hosts by group, and install and monitor the status of the Agent. Users can also log in to target hosts as a client over SSH or the Windows 3389 remote port and perform operations.
1.1 Host Management
Host Management is mainly used to onboard the hosts you want to manage, check whether the current onboarding status is normal, and log in to hosts for management and operations.
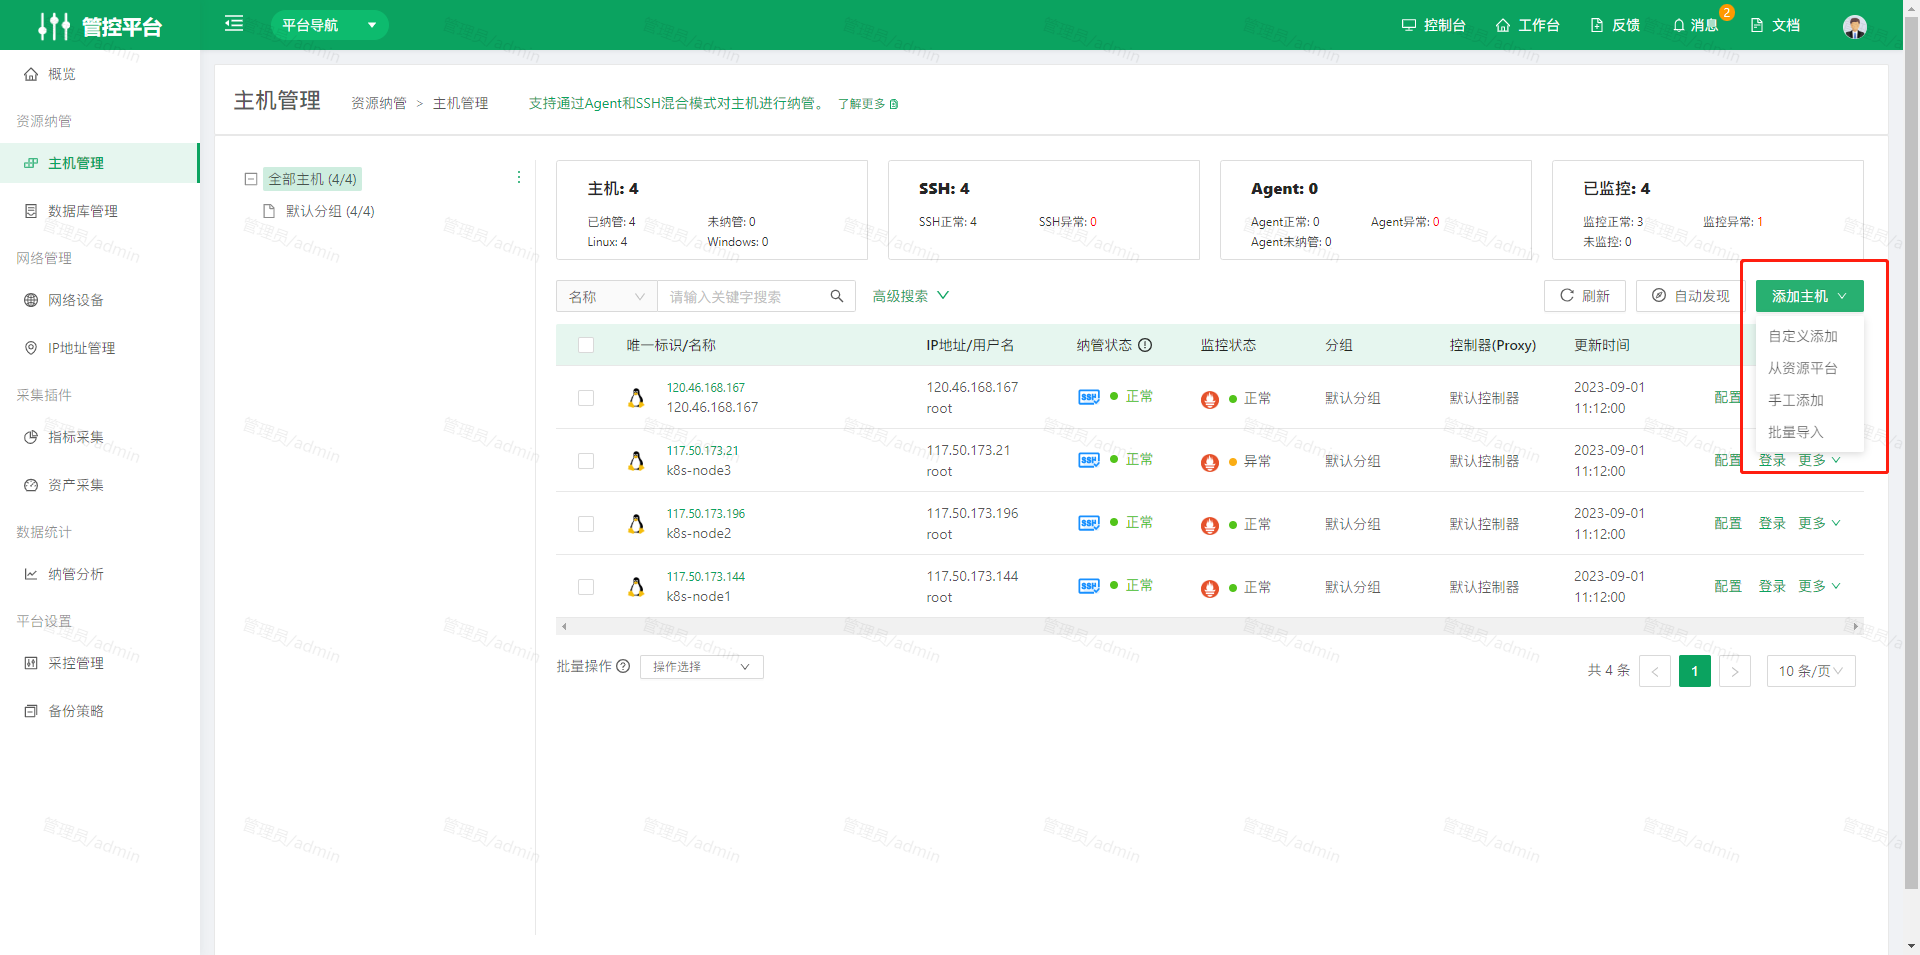
Click the "Add Host" button in the upper right corner of the page. There are four ways to add hosts: custom add, add from Resource Platform, manual add, and batch import
- Custom add host: You can configure host-related fields yourself to create a host.
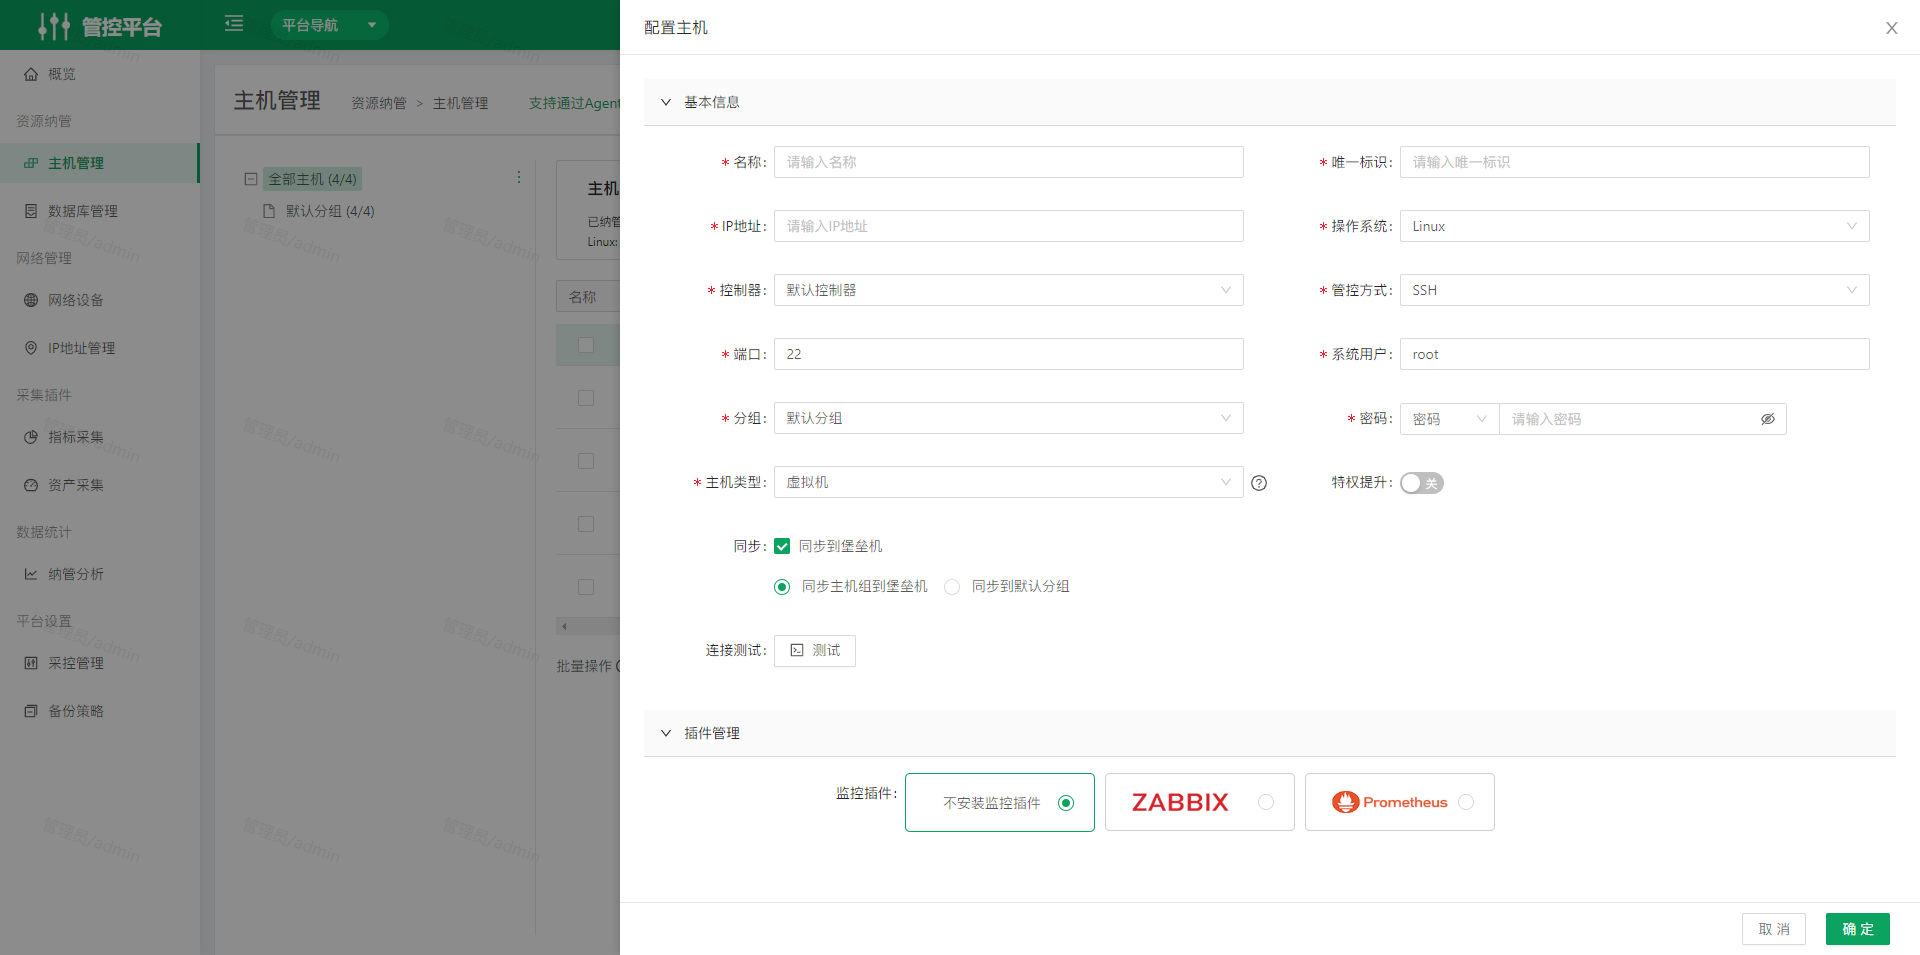
Install the Zabbix monitoring plugin: After installing the monitoring plugin on a host, view the monitored host data on the Monitor Platform platform > Host Monitoring page.
Prerequisite: Before installing the Zabbix monitoring plugin, first add an available Zabbix Server on the Acquisition and Control Management > Zabbix Integration page. See the Zabbix integration documentation >
OpsAny's monitoring capabilities rely on Zabbix. To use basic monitoring features you must integrate Zabbix. You can integrate a Zabbix Server that your enterprise has already deployed.
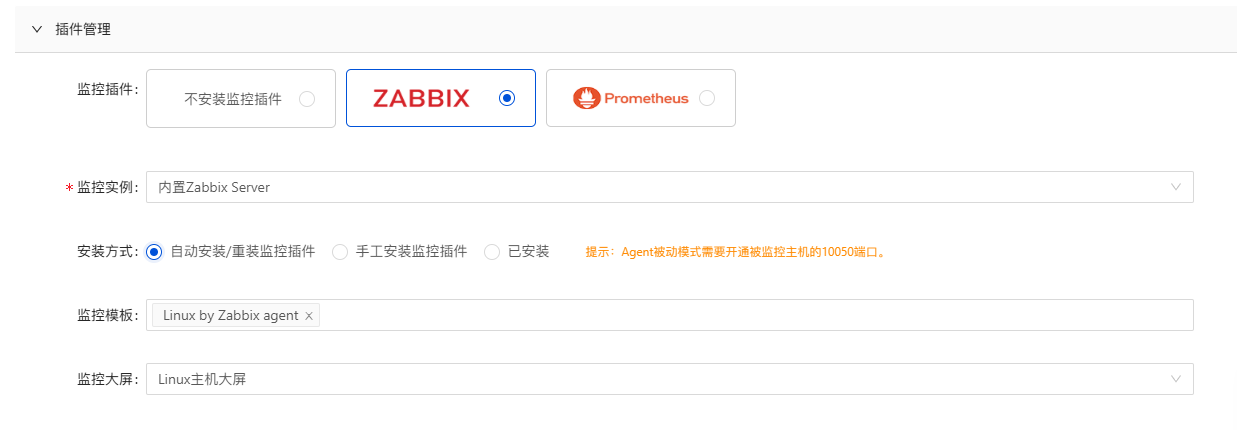
- Automatic install/reinstall of the monitoring plugin: OpsAny automatically deploys the Zabbix Agent (passive mode) on the target host. Passive mode requires port 10050 to be open on the monitored host.
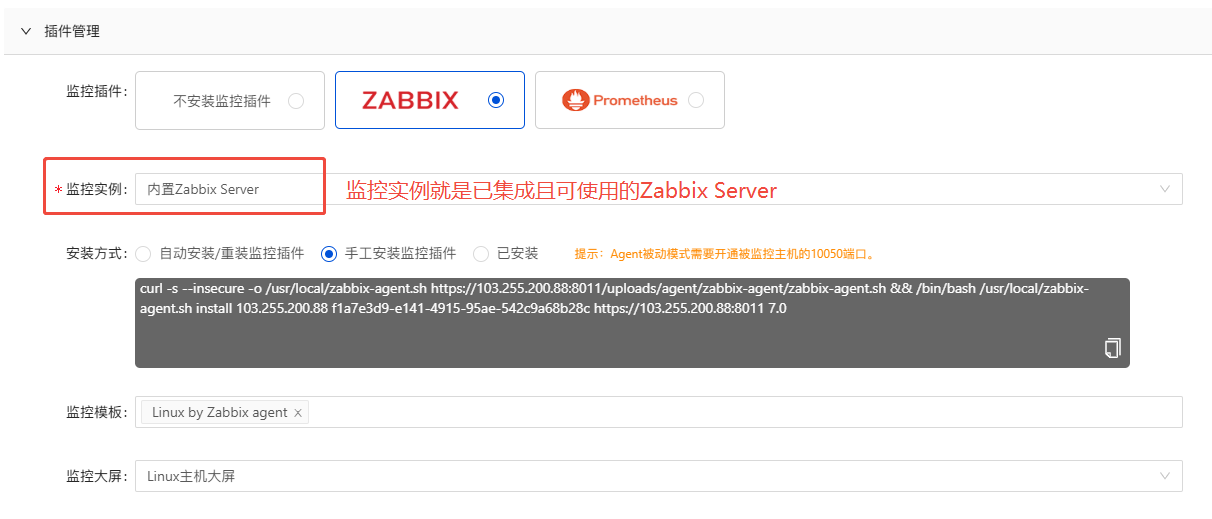
- Manual install of the monitoring plugin: Copy the installation command and manually deploy the Zabbix Agent (passive mode) on the target host. Passive mode requires port 10050 to be open on the monitored host.
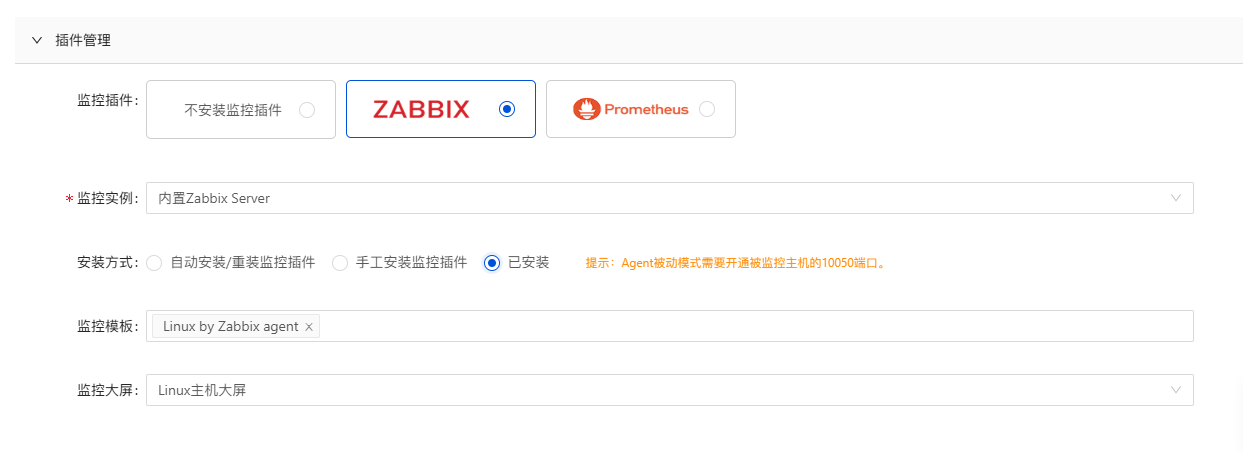
- Installed: Indicates that you have installed the monitoring plugin on the target host and opened port 10050 on the monitored host. Select the correct monitoring template to complete monitoring data collection.
Install the Prometheus monitoring plugin: After installing the monitoring plugin on a host, view the monitored host data on the Application Monitoring platform > Host Monitoring page (note: Application Monitoring is an Enterprise Edition module).
Prerequisite: Before installing the Prometheus monitoring plugin, first add an available Prometheus Server on the Acquisition and Control Management > Prometheus Integration page. See the Prometheus integration documentation >
The OpsAny Community Edition supports Prometheus integration. When adding hosts in the Control Platform, hosts can be added to the Prometheus Server automatically through Consul. If you already have a Prometheus instance that you want to connect directly to OpsAny, it must be discoverable through Consul for this to work.
- Automatic install/reinstall of the monitoring plugin: OpsAny automatically installs the Exporter on the target host, and port 9100 must be open on the monitored host.
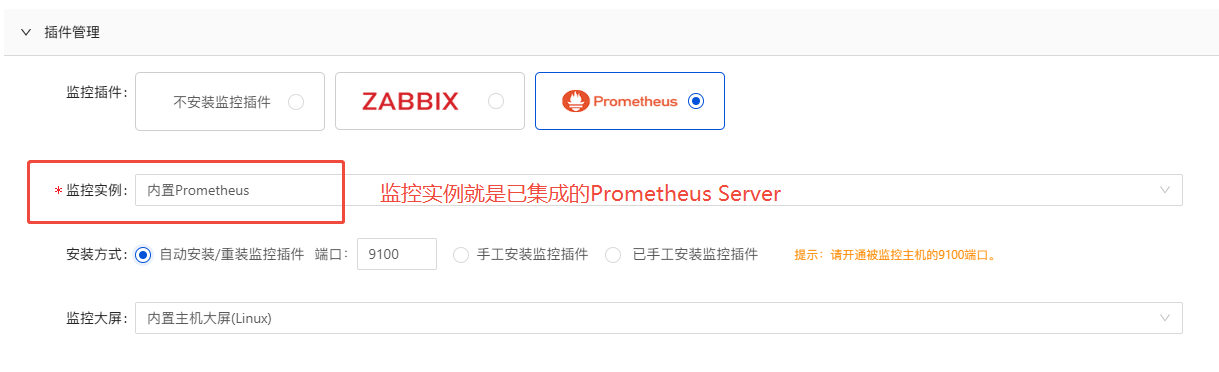
- Manual install of the monitoring plugin: Copy the installation command and manually install the Exporter on the target host, and port 9100 must be open on the monitored host.
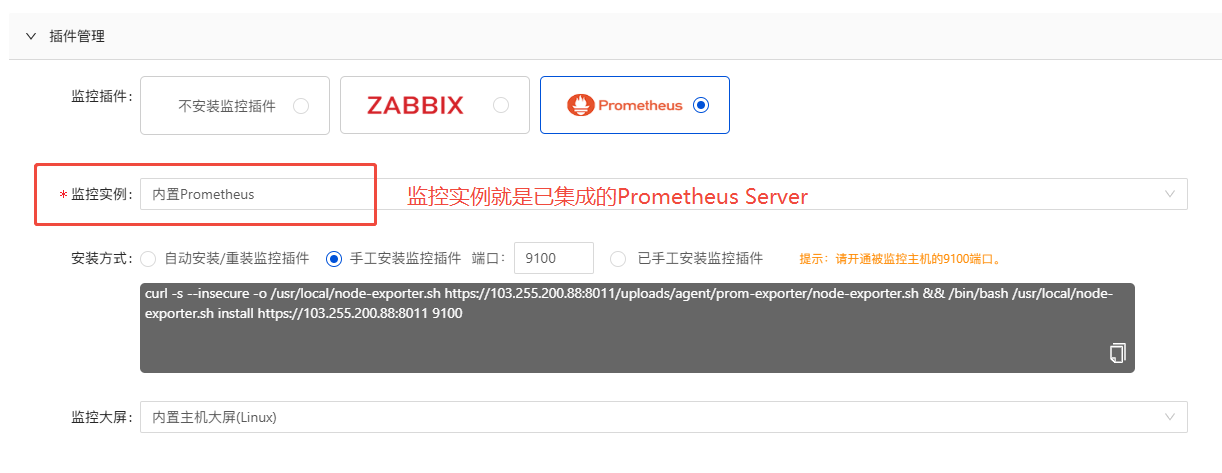
- Installed: Indicates that you have installed the monitoring plugin on the target host and opened port 9100 on the monitored host. Select the correct monitoring template to complete monitoring data collection.
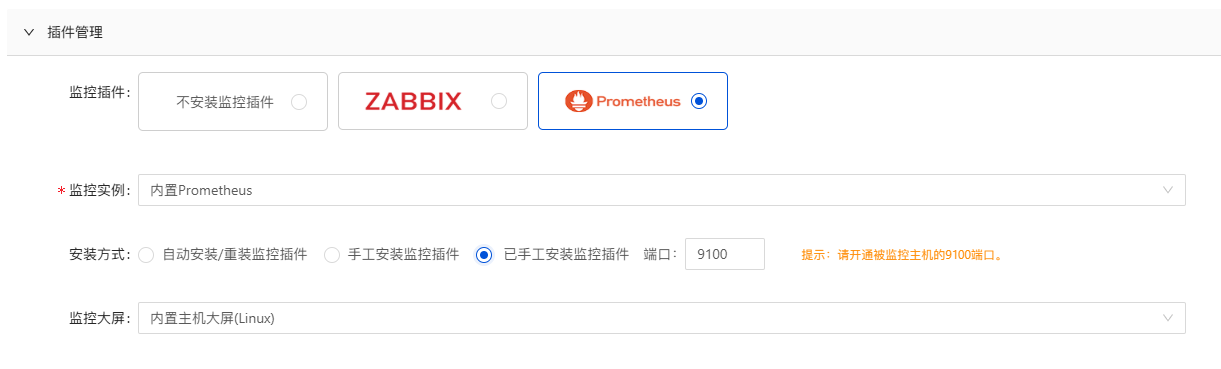
Each host can have a monitoring component or not. By default, no monitoring component is added.
- Add hosts from the Resource Platform: You can select physical machines, virtual machines, cloud hosts, and other hosts to manage from CMDB hosts. None of the hosts in the list are managed in the Control Platform.
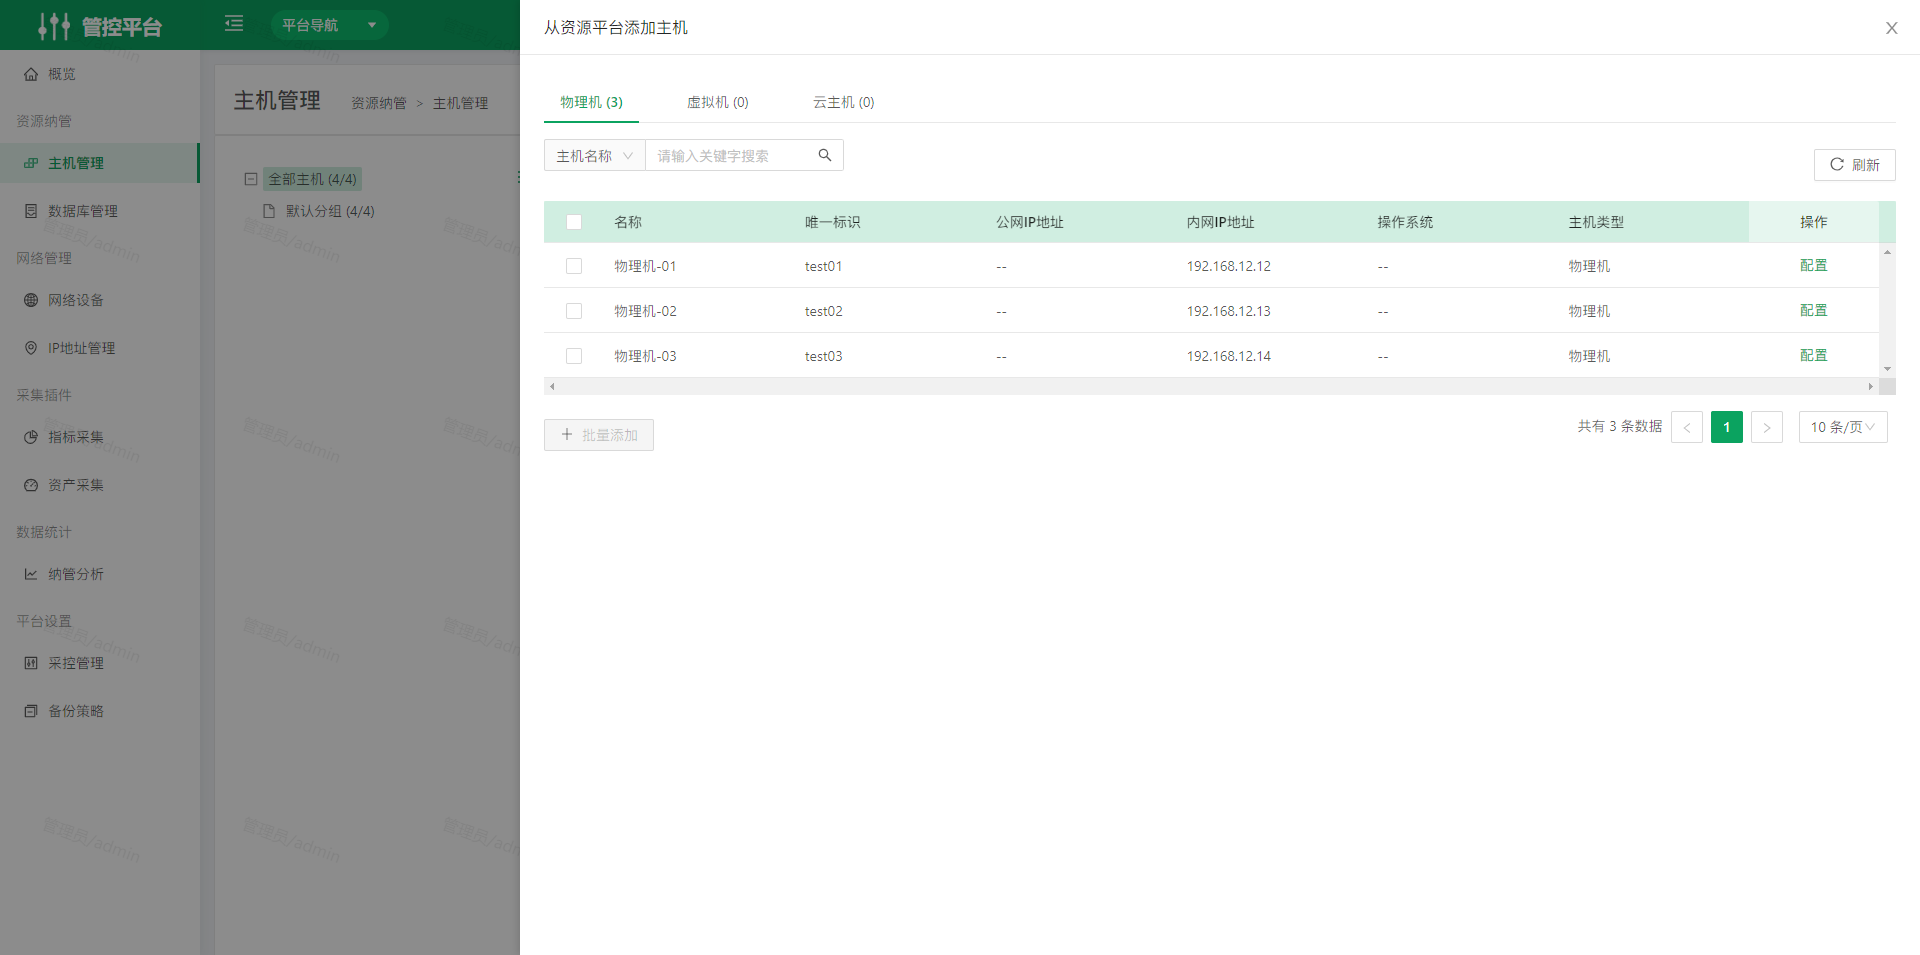
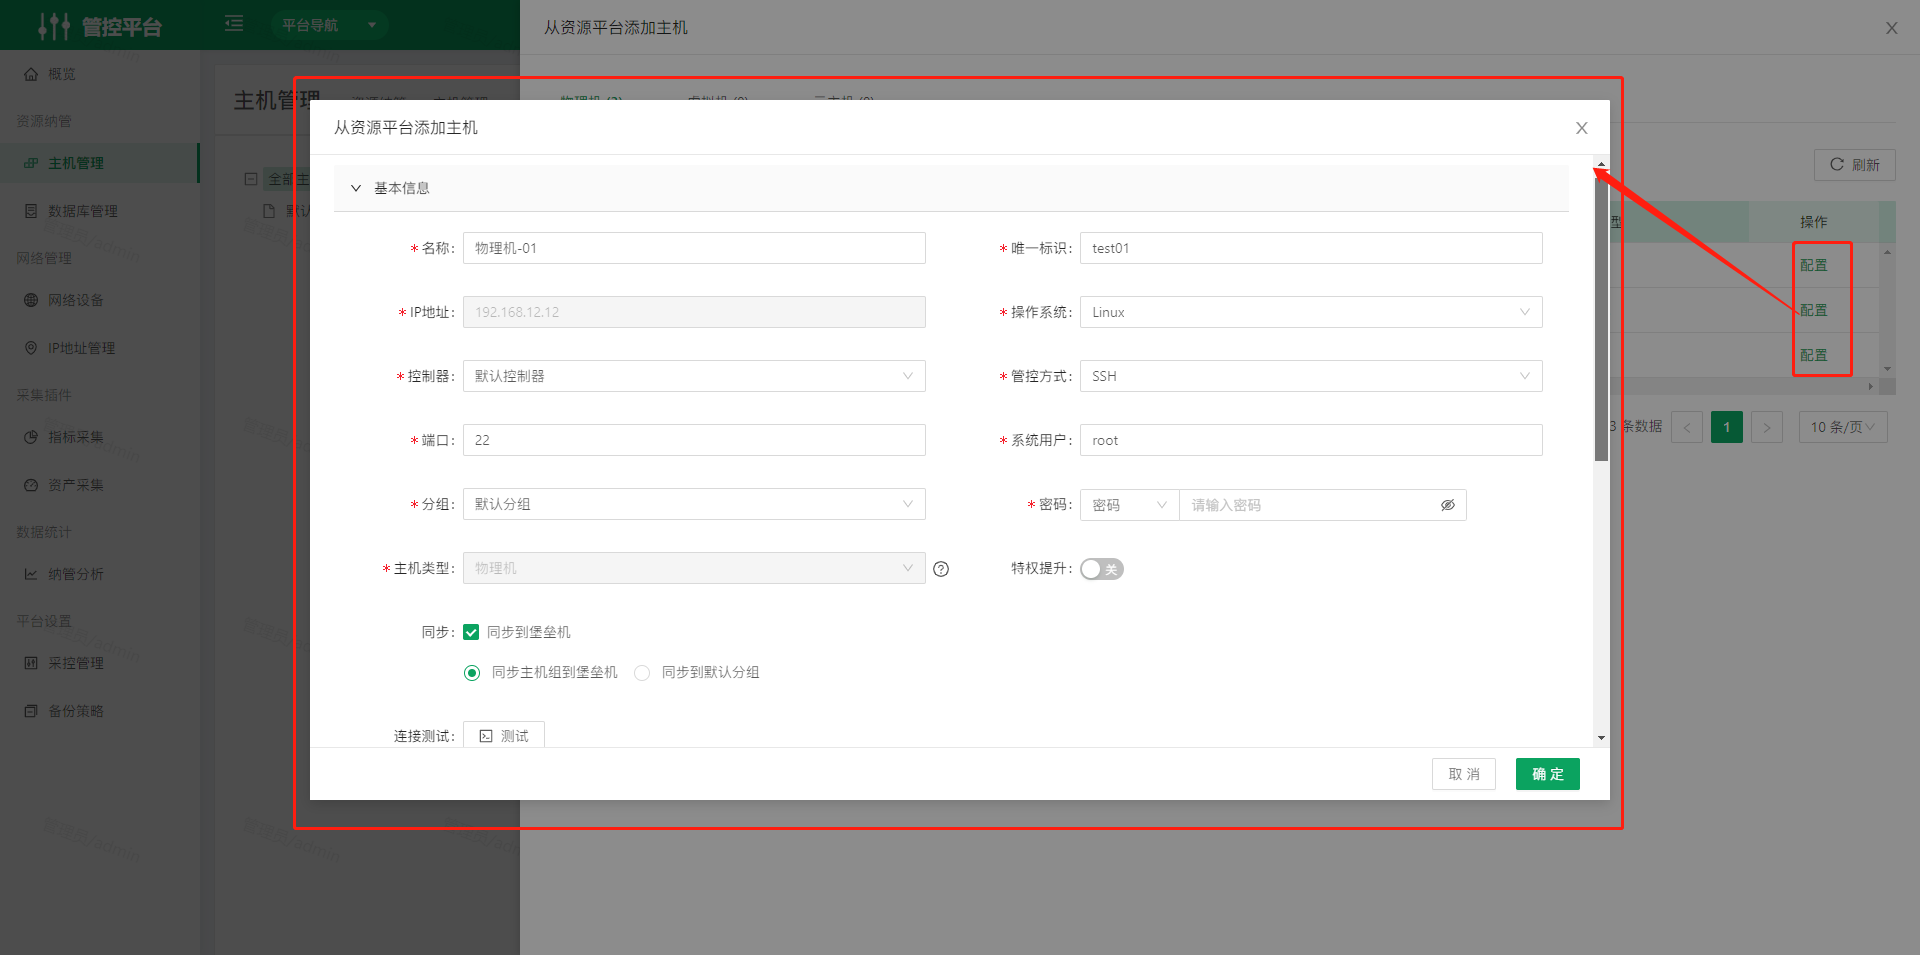
- Click the Configure button, fill in the relevant fields, and save the host to the Host Management list.
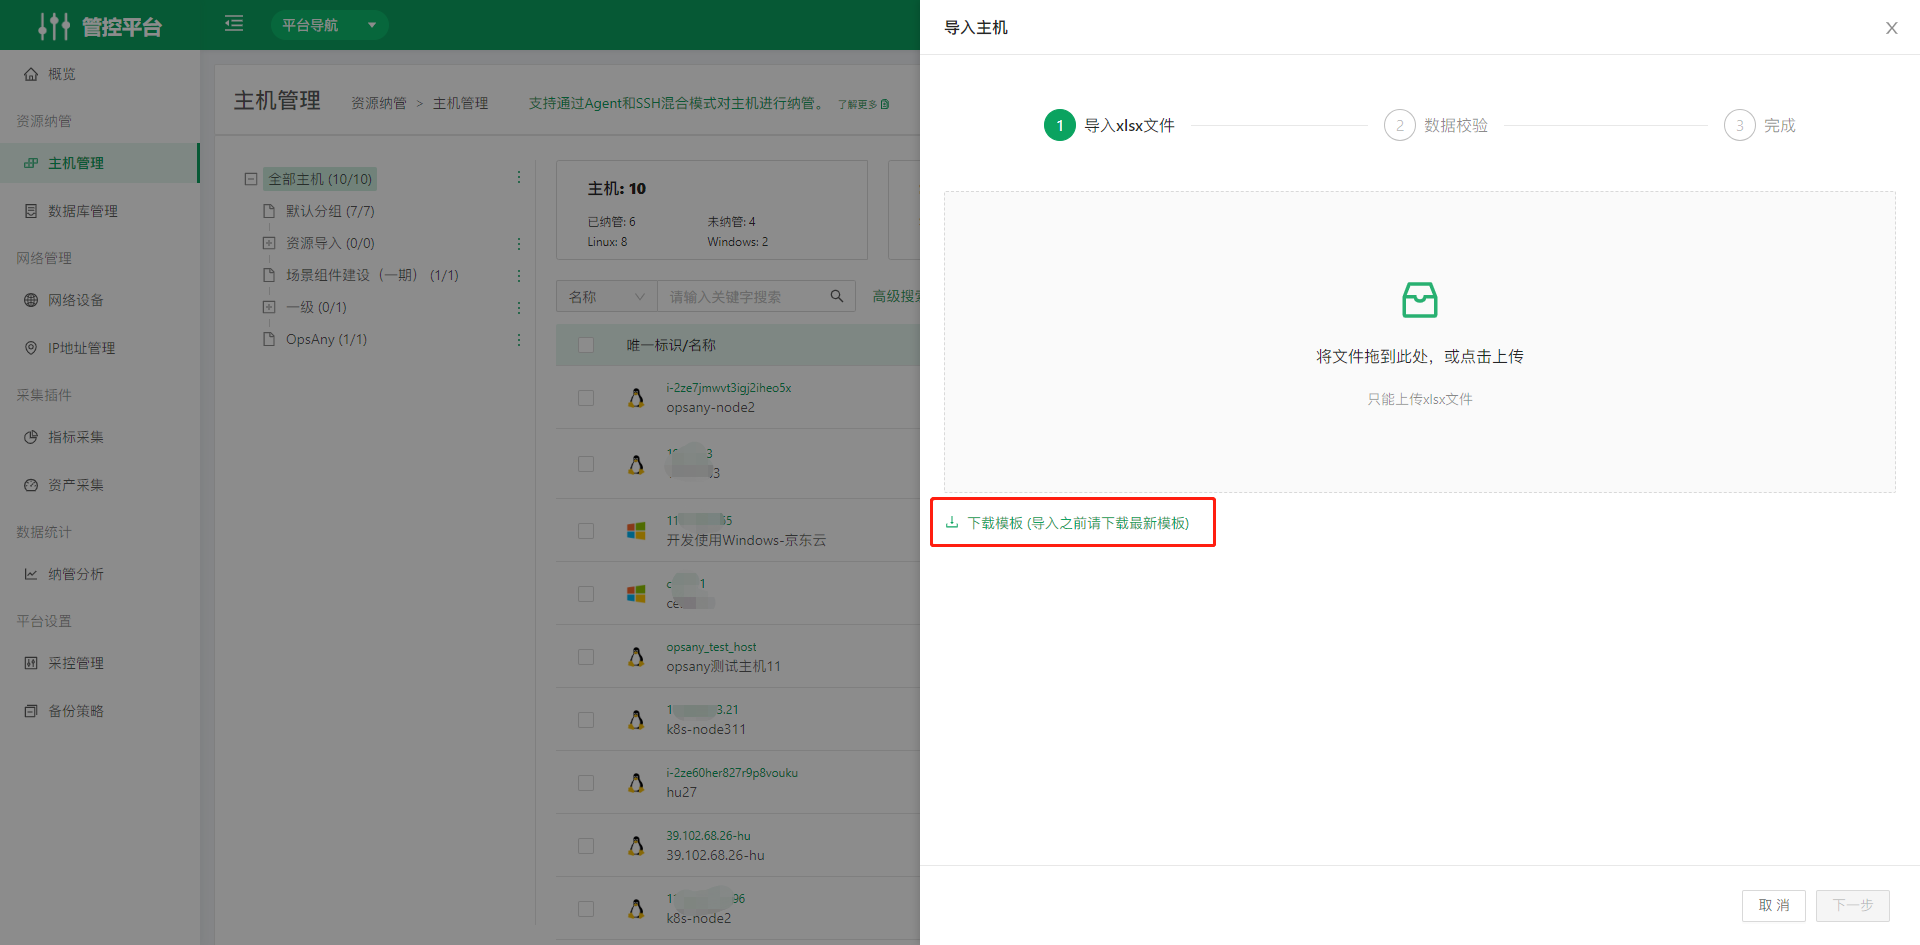
- Batch import hosts: You can import data for multiple hosts at once. Before importing, download the xlsx template, fill in the host data, and upload it locally. Imported data is validated in step two to ensure each host's information is complete and correct, avoiding import errors or omissions.
- The operations column in the Host Management list includes Configure, Log In, Asset Collection, Connectivity Test, Automatic Install, Manual Install, Restart Agent, Uninstall Agent, Add to Onboarding, Remove from Onboarding, Installation Log, Sync Monitoring, and Sync CMDB.
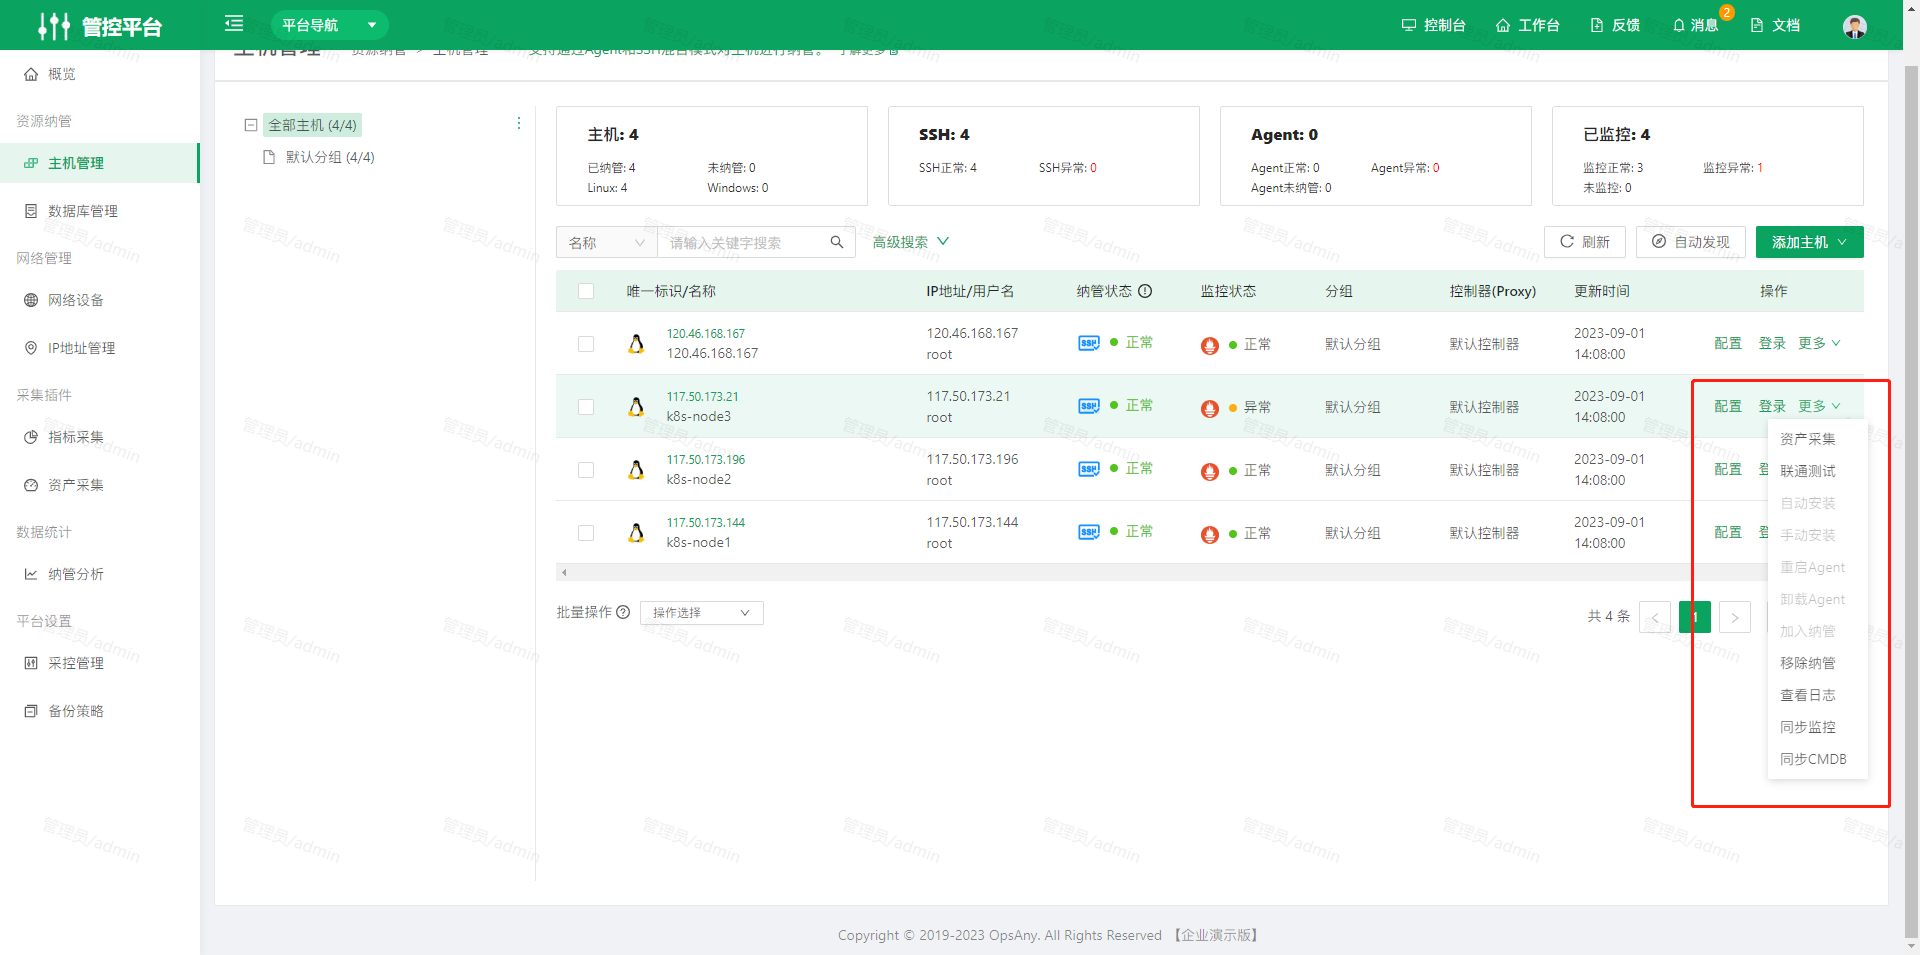
- Configure: Edit the target host's information.
- Log In: Access the target host as a client and perform operations.
- Asset Collection: Mainly used to synchronize the static resource information of the target host.
- Connectivity Test: Tests whether the Agent is available.
- Automatic Install: Installs the Agent on the target host.
- Manual Install: For installing the Agent on the target host manually.
- Restart Agent: Restart the Agent remotely.
- Uninstall Agent: Uninstall the Agent remotely.
- Add to Onboarding: For automatically discovered hosts, you can onboard them directly; the onboarding process includes information collection.
- Remove from Onboarding: Removes the target host from the Host Management list.
- Installation Log: View log statistics from the automatic installation process, mainly the most recent installation log.
- Sync Monitoring: Adds a monitoring component for a single host.
- Sync CMDB: Clicking Sync CMDB makes the system detect the host and synchronize it to CMDB automatically.
1.2 Database Management
Onboard databases. Supported database types include MySQL, Redis, MongoDB, Elasticsearch, PostgreSQL, DM (Dameng), and KingbaseES.
Note: Database Management is an Enterprise Edition feature.
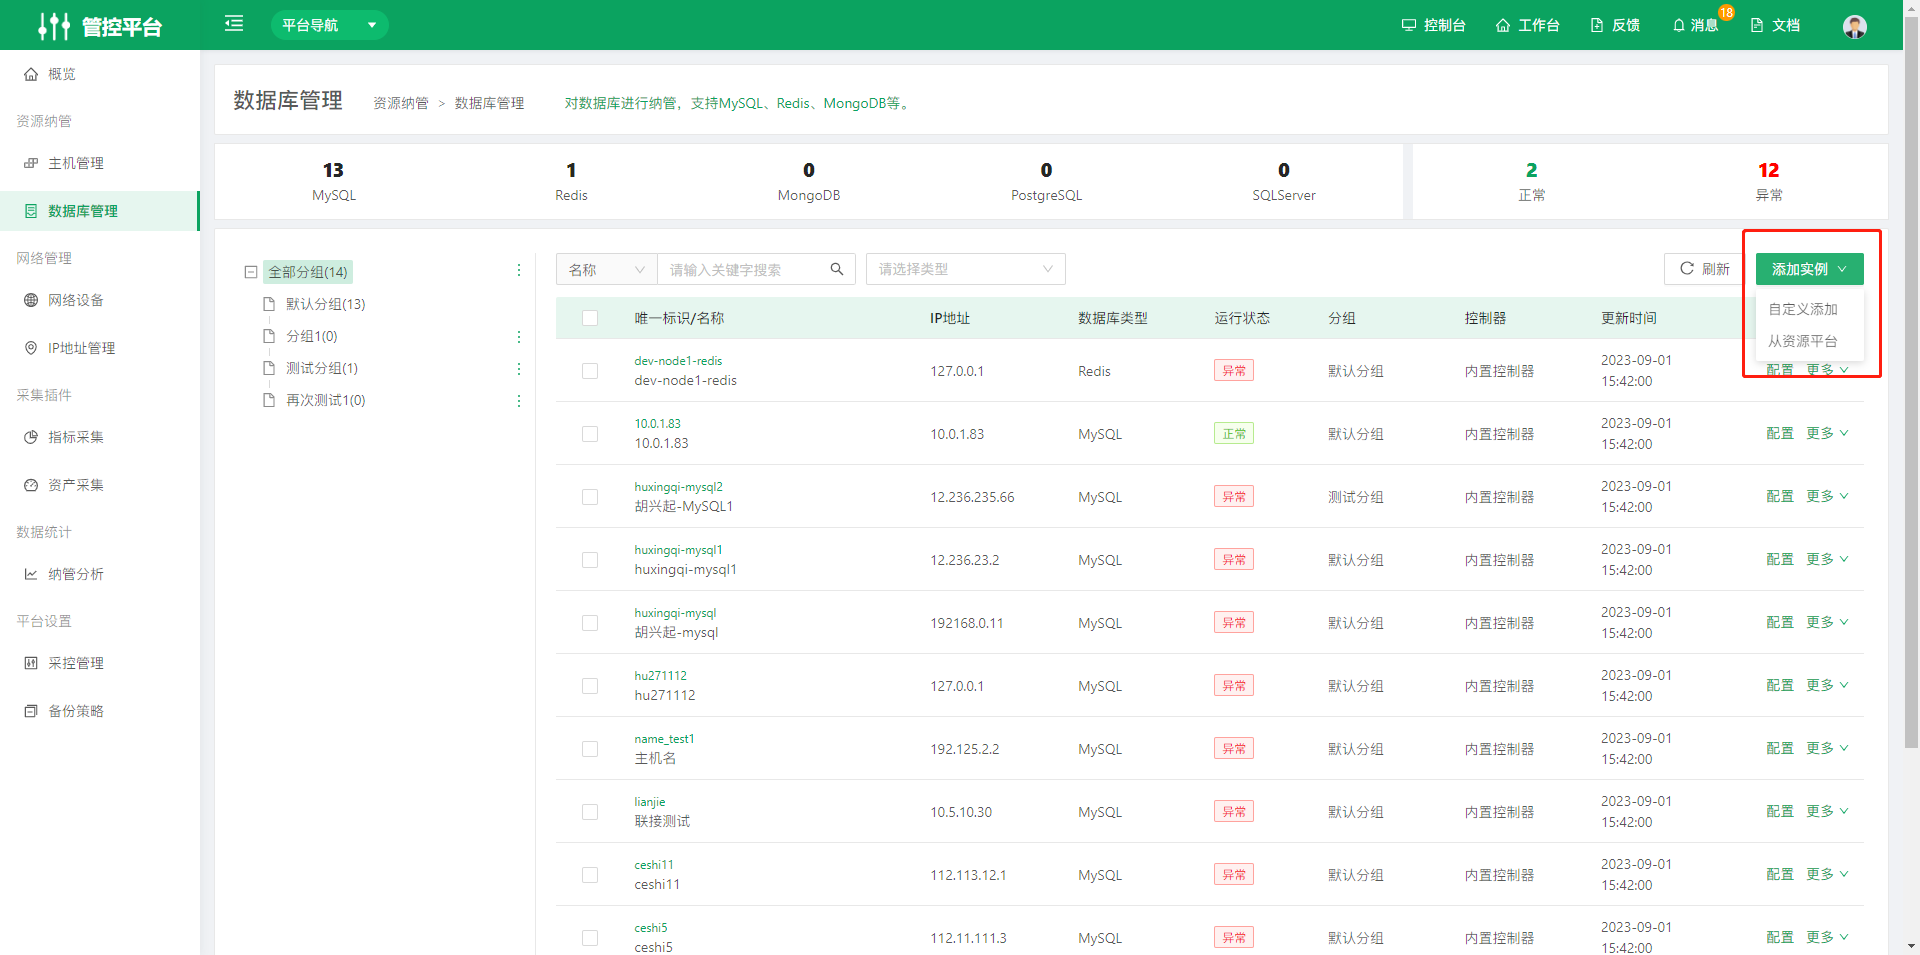
Click the "Add Instance" button in the upper right corner of the page. There are two ways to add database instances: custom add and add from Resource Platform.
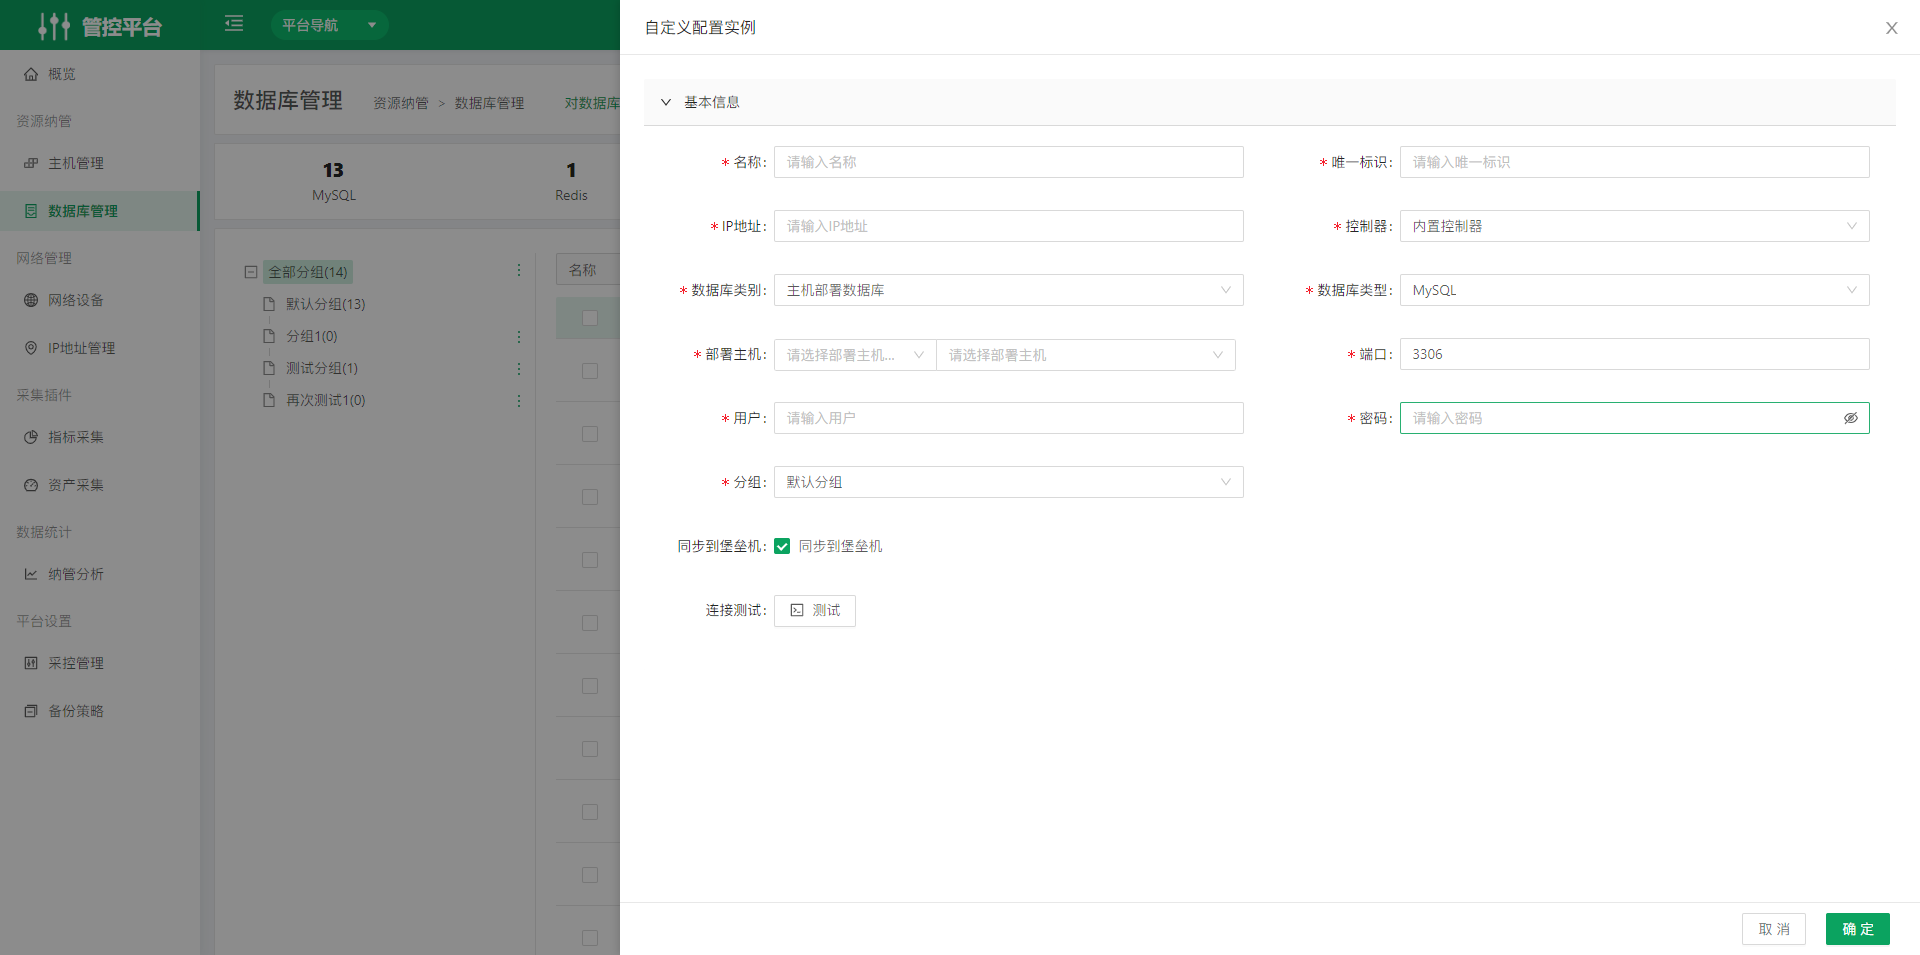
- Custom add: You can configure database-related fields yourself to create a database.
- Add from Resource Platform: You can select MySQL, cloud MySQL, Redis, and other databases to manage from CMDB databases. None of the databases in the list are managed in the Control Platform.
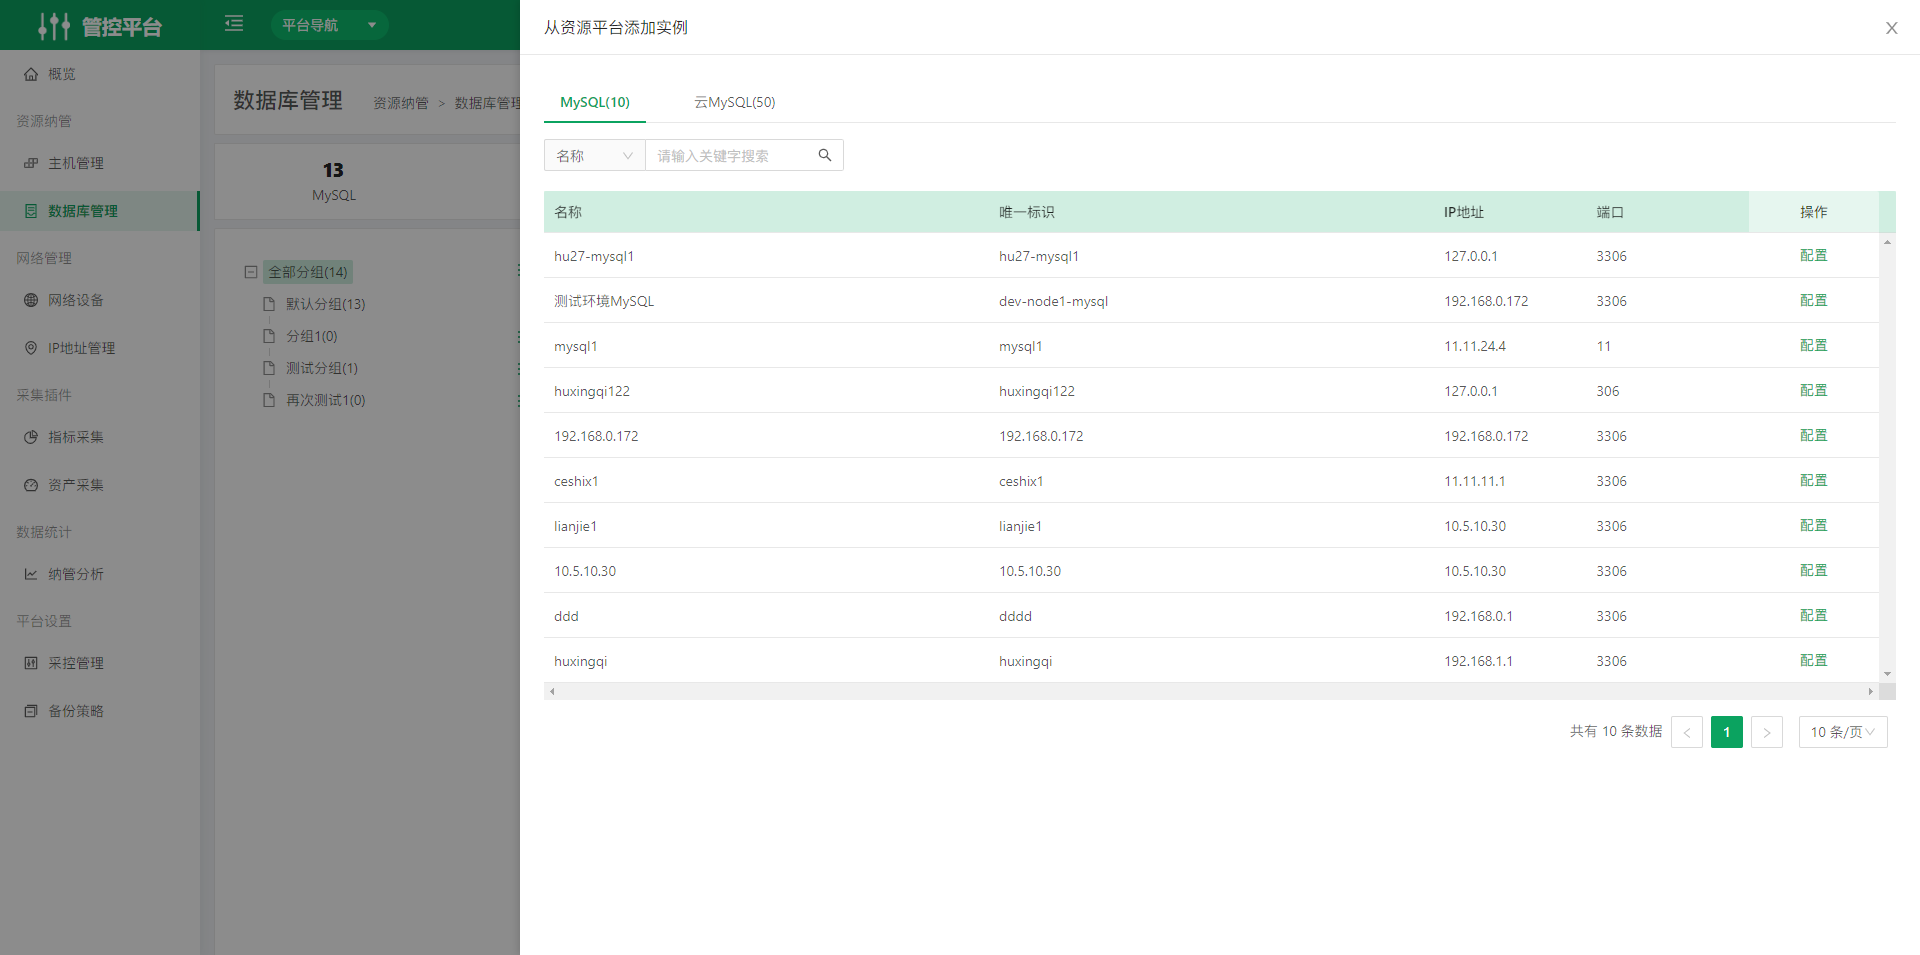
- The operations column in the Database Management list includes Configure, Remove from Onboarding, and Connectivity Test.
- Click the unique identifier in the list to open the details page of the corresponding database.
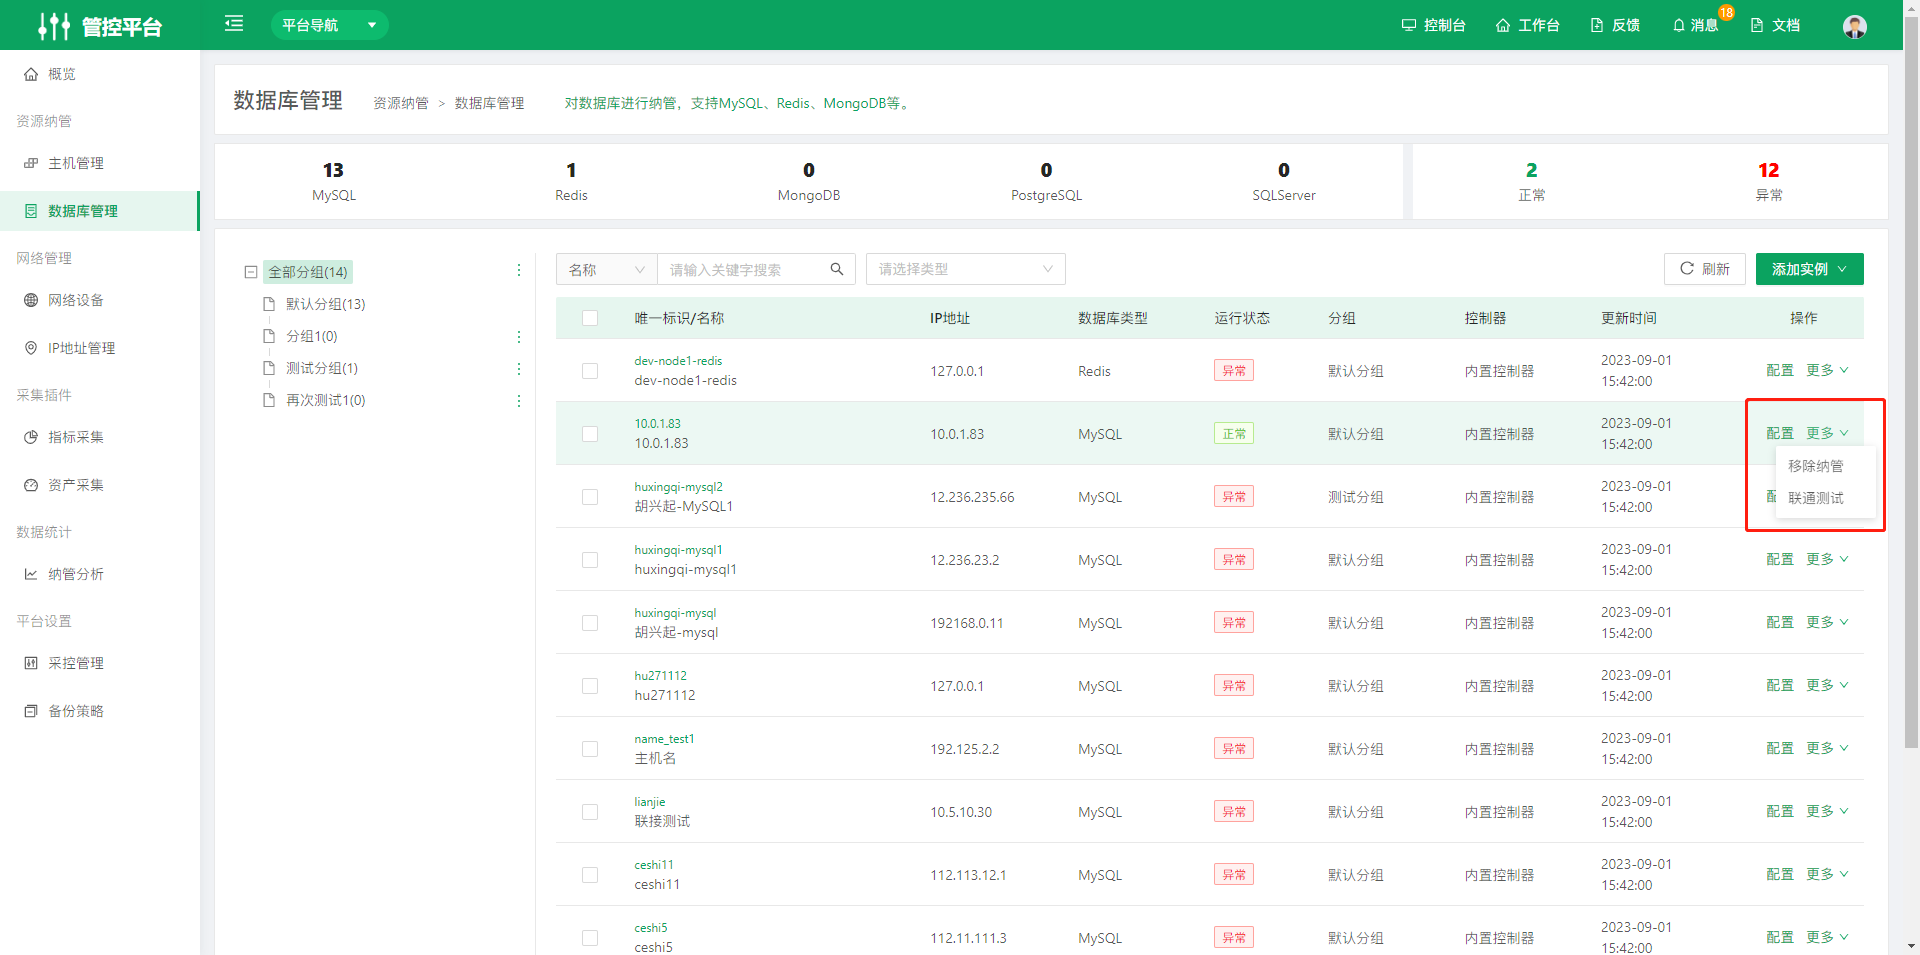
- Configure: Edit the target database's information.
- Remove from Onboarding: Removes the target database from the Database Management list.
- Connectivity Test: Tests whether the Agent is available.
1.3 Middleware Management
Onboard middleware. Supported middleware types include RabbitMQ and Consul.
Note: Middleware Management is an Enterprise Edition feature.
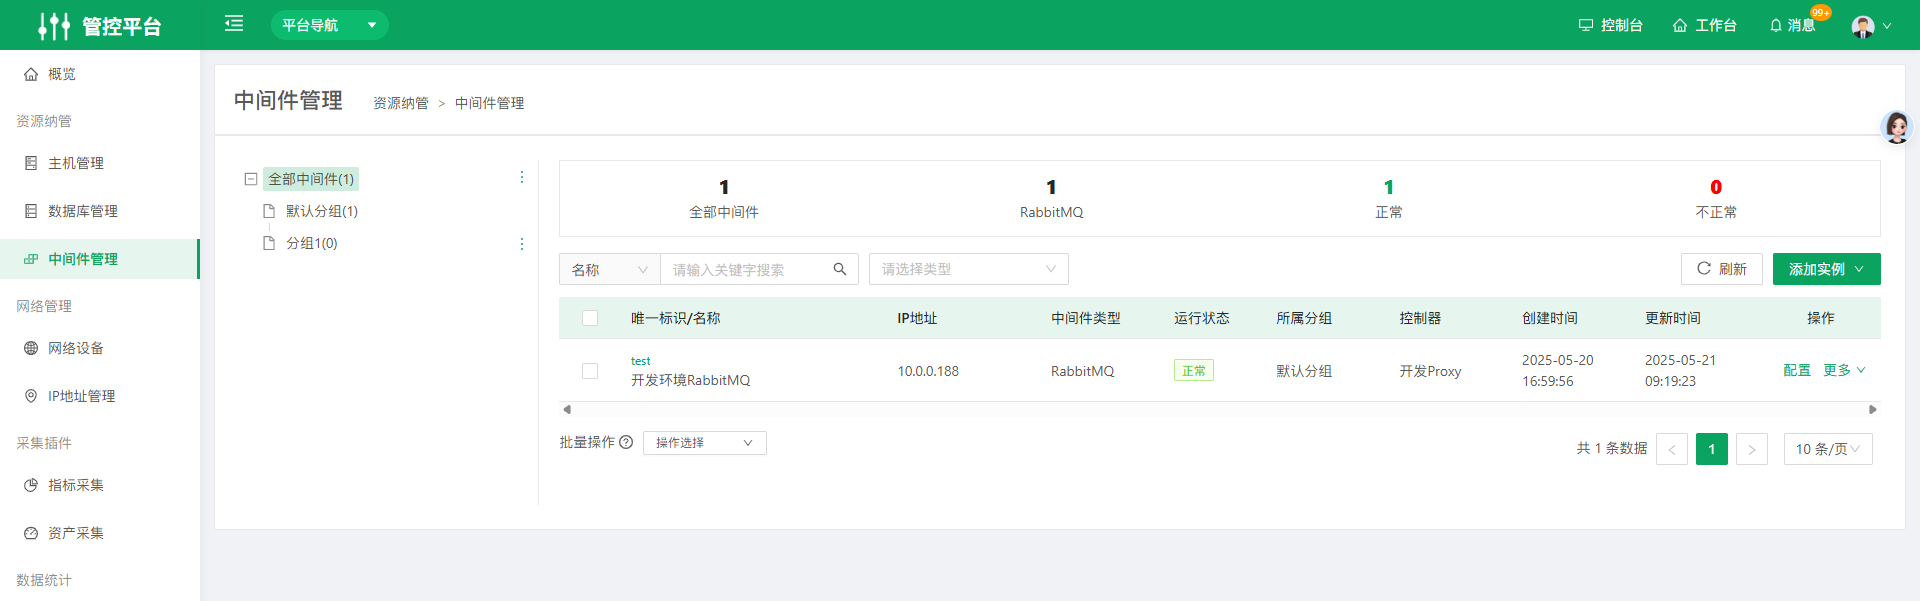 The operations column in the Middleware Management list includes Configure, Remove from Onboarding, and Connectivity Test.
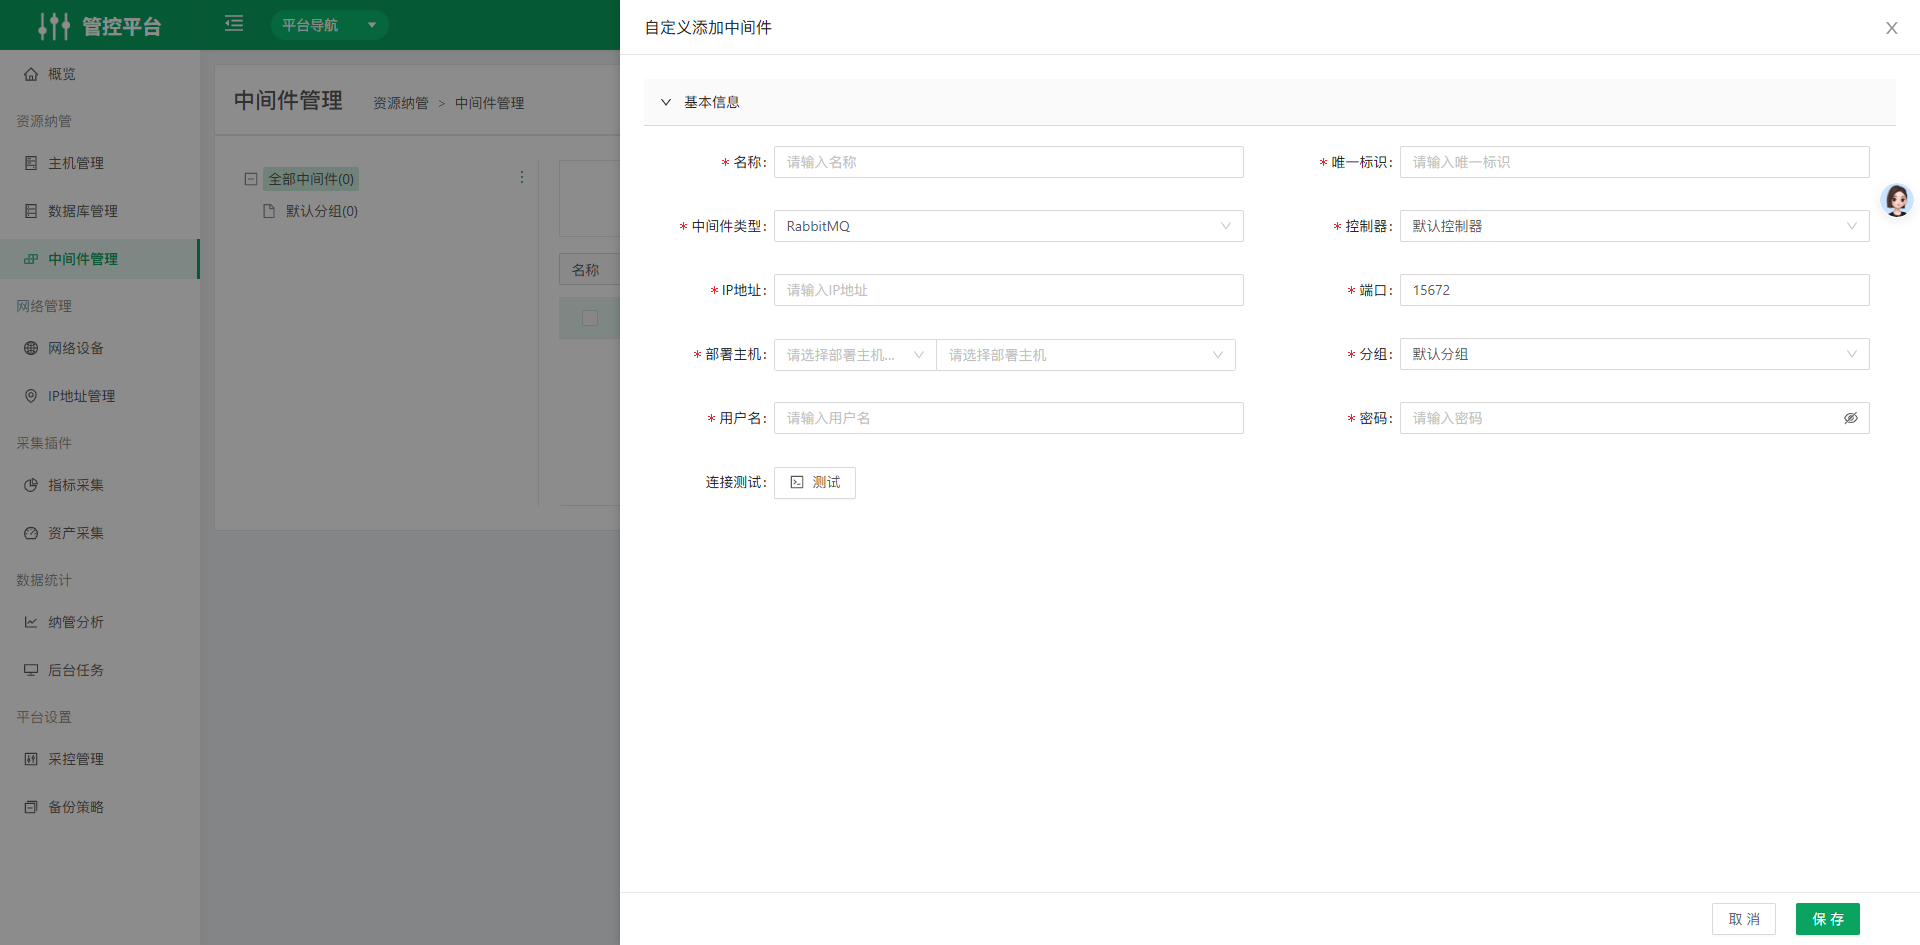 You can configure middleware-related fields yourself to create middleware.
- Click the unique identifier in the list to open the details page of the corresponding middleware.
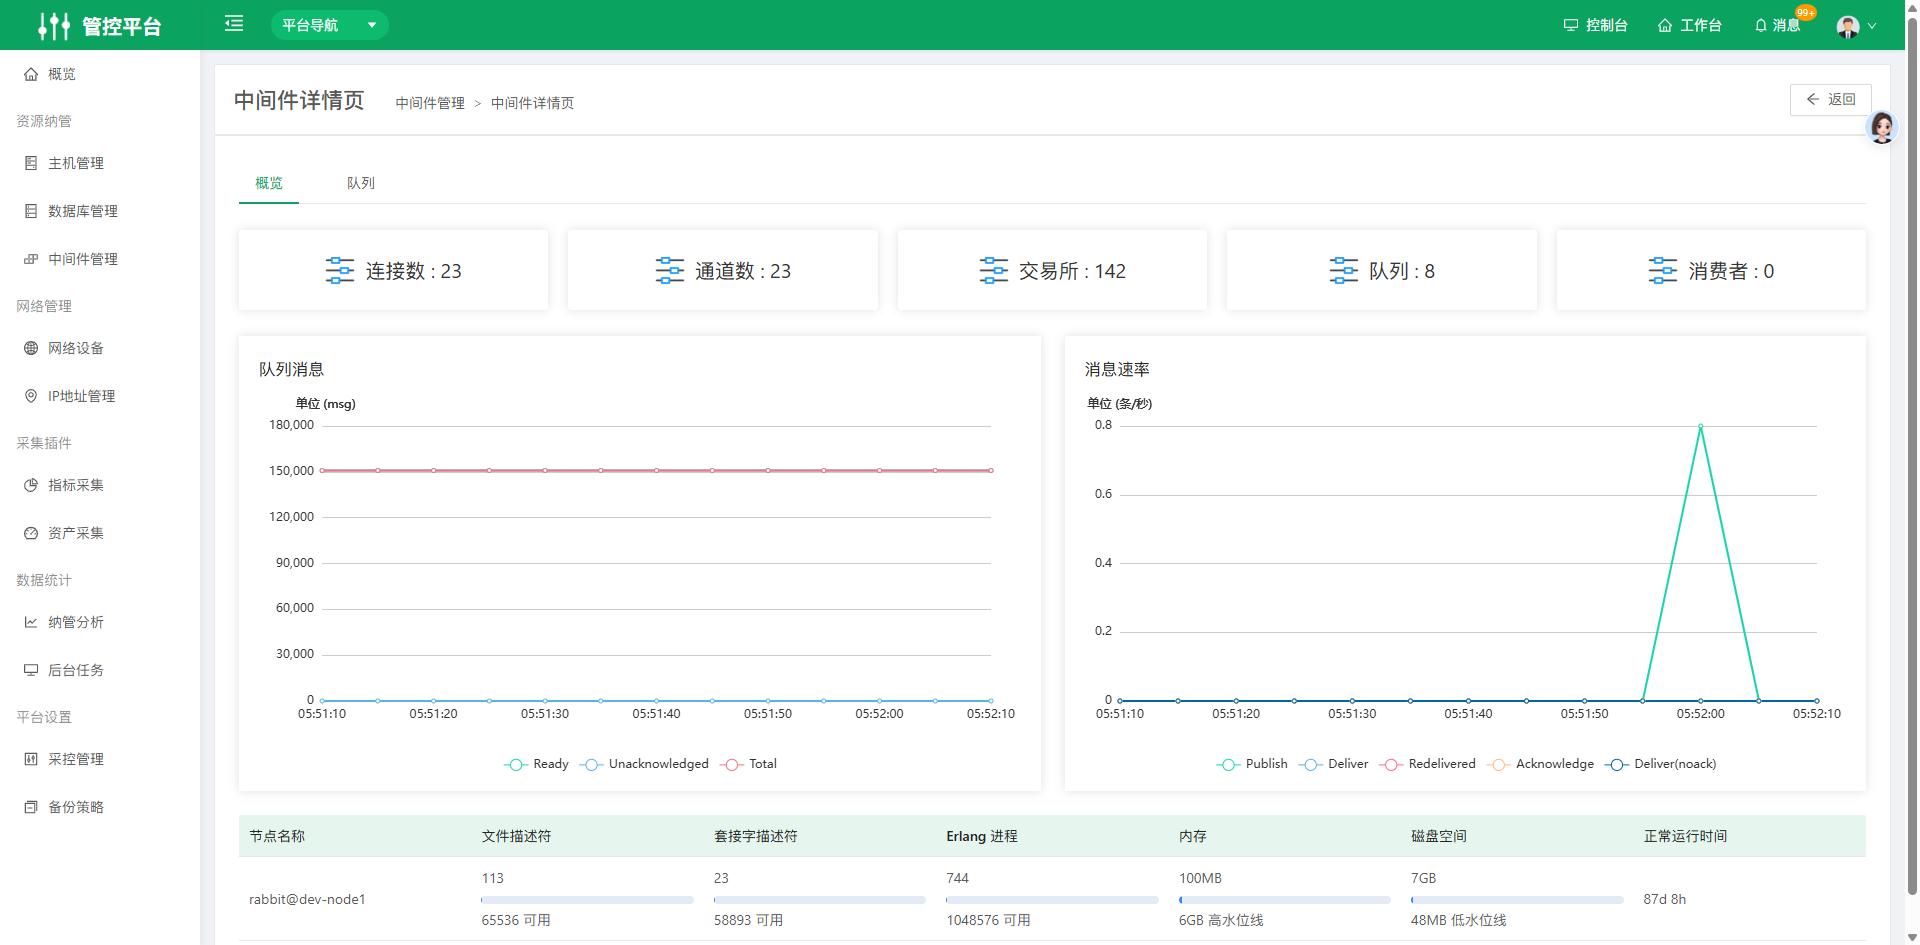
2. Network Management
2.1 Network Devices
Network Device Management helps users manage network devices such as switches and routers. It currently supports management over SNMP, onboarding over SSH and Telnet, and monitoring through Zabbix.
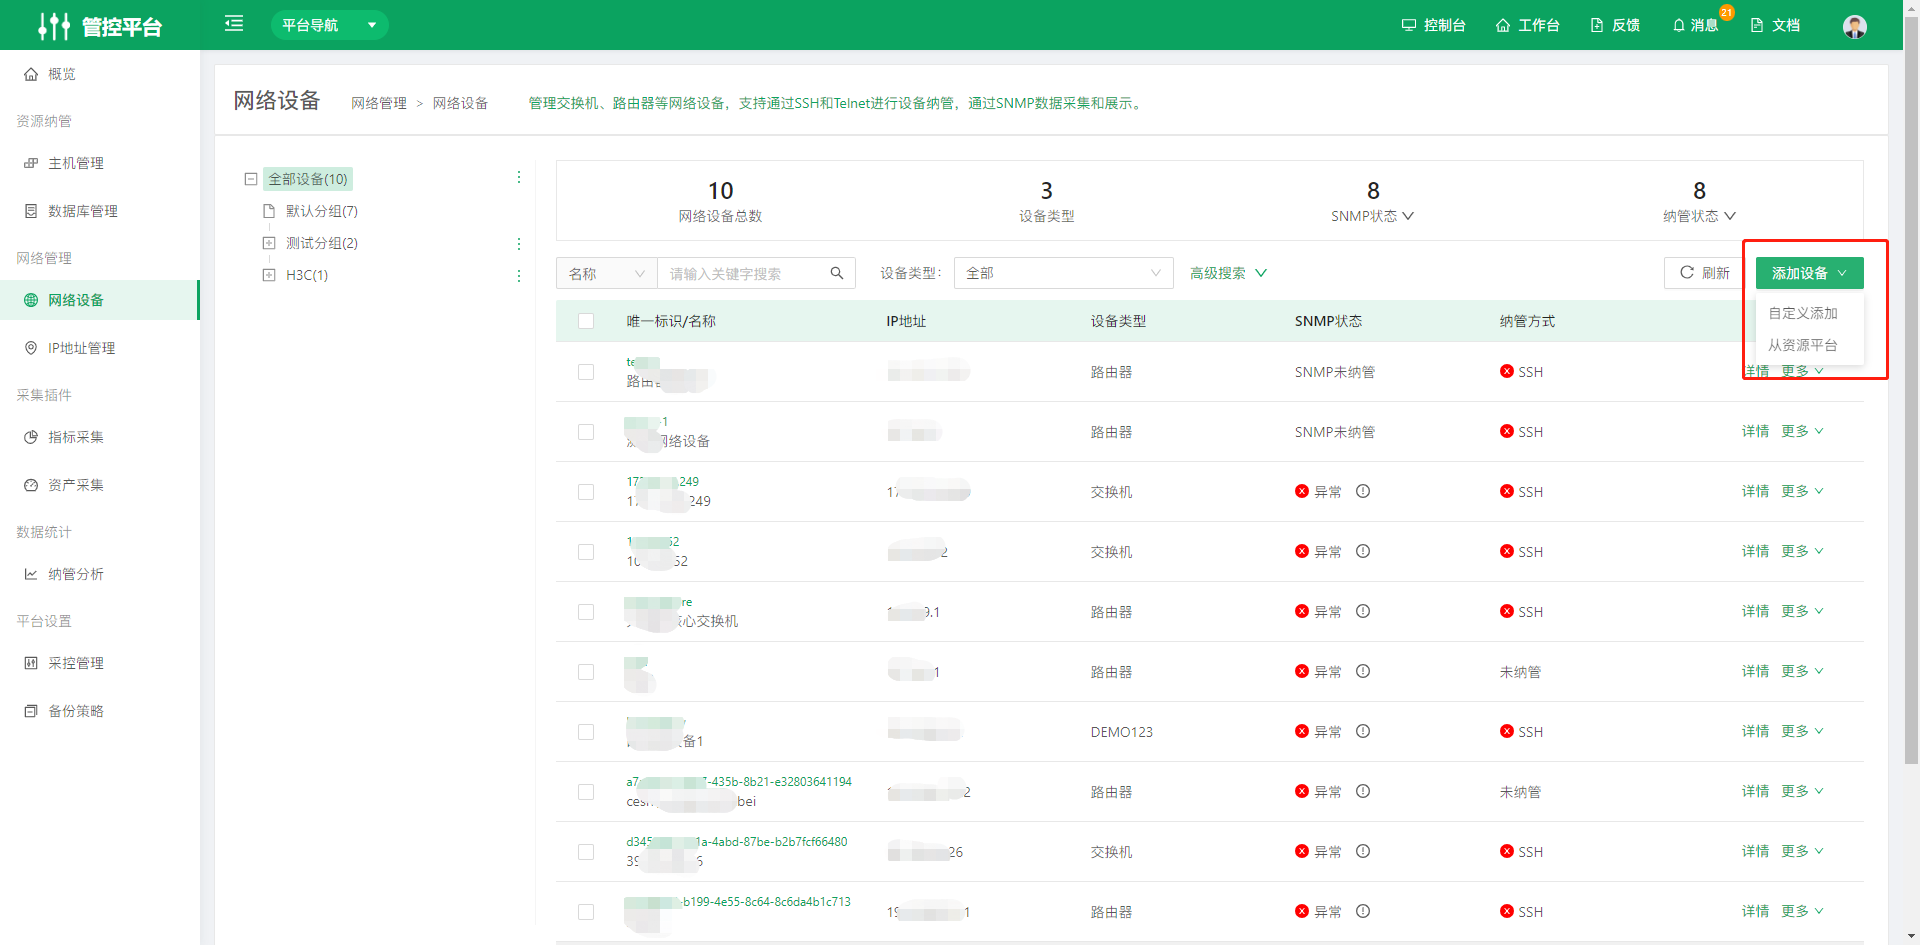
Custom add network device
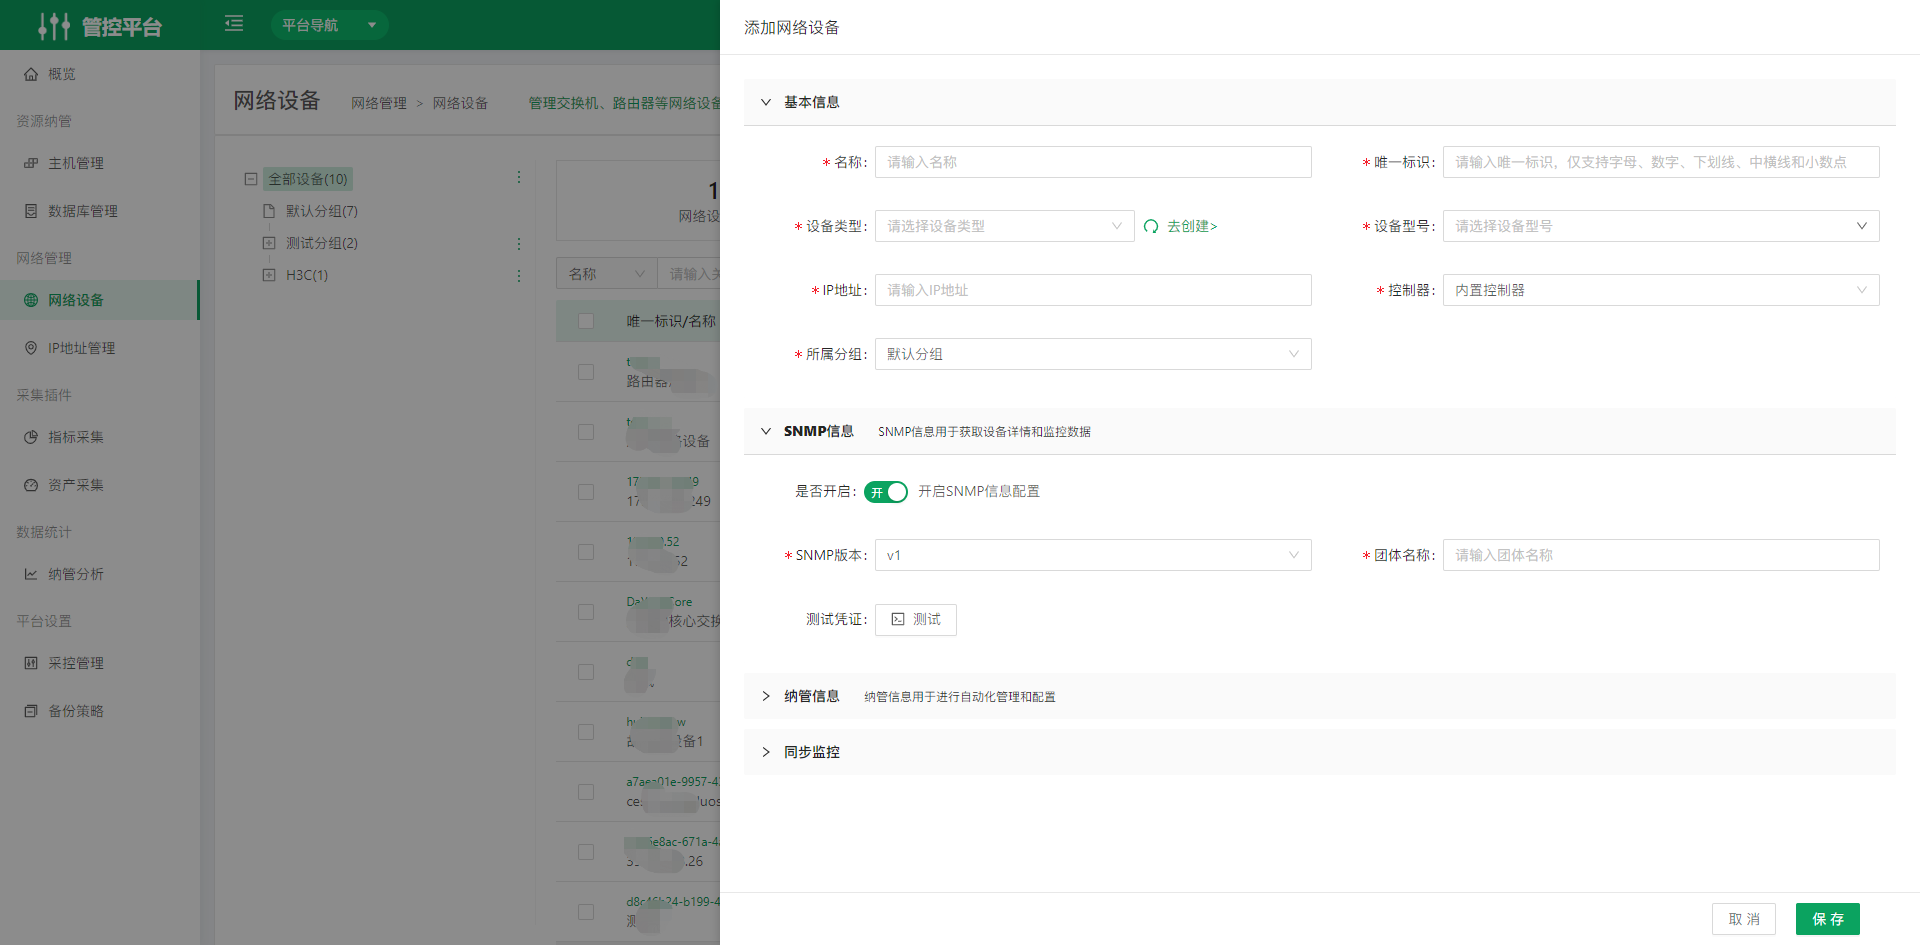
- Basic information: Select a network device model from CMDB and assign a group.
- SNMP information: Select the version and community name.
- Onboarding information: Manage devices over SSH or Telnet.
- Sync Monitoring: Zabbix is currently supported for management.
Add network devices from the Resource Platform
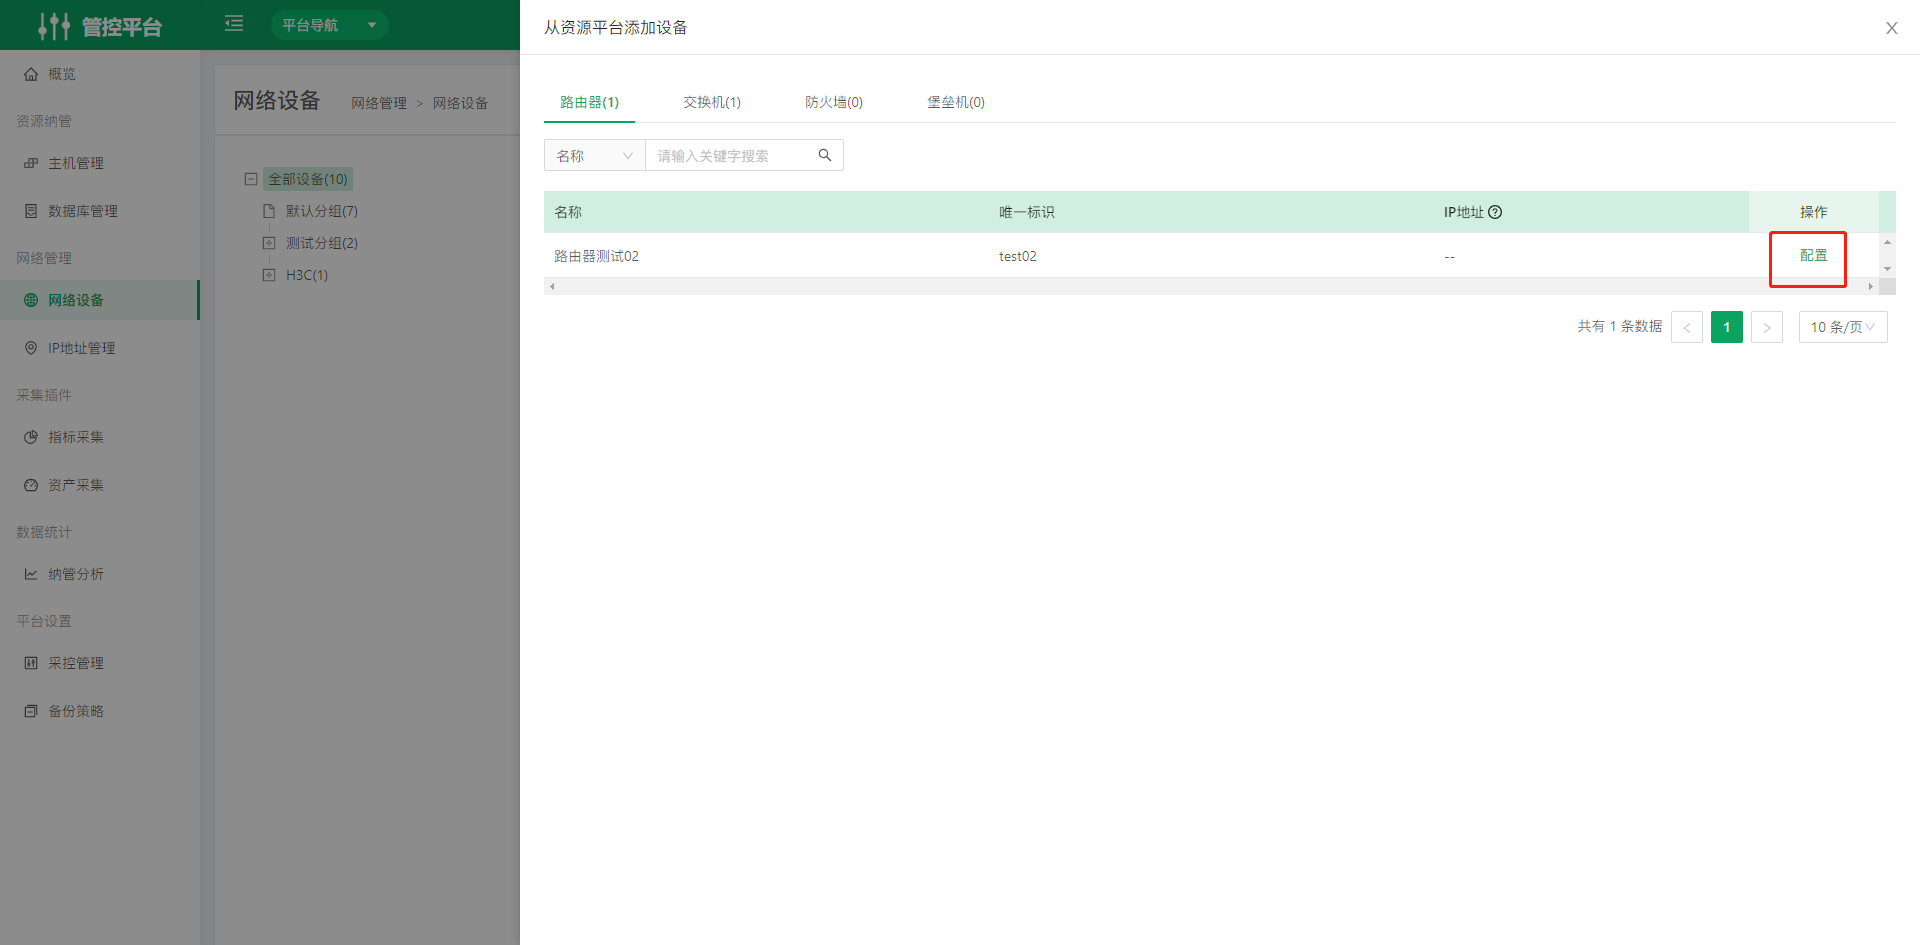
- When adding network devices from the Resource Platform, you can configure different device types individually. Device types are obtained from the resource models in the Resource Platform.
2.2 IP Address Management
Scans the entered IP address segments and dynamically identifies the usage status of the IP address pool.
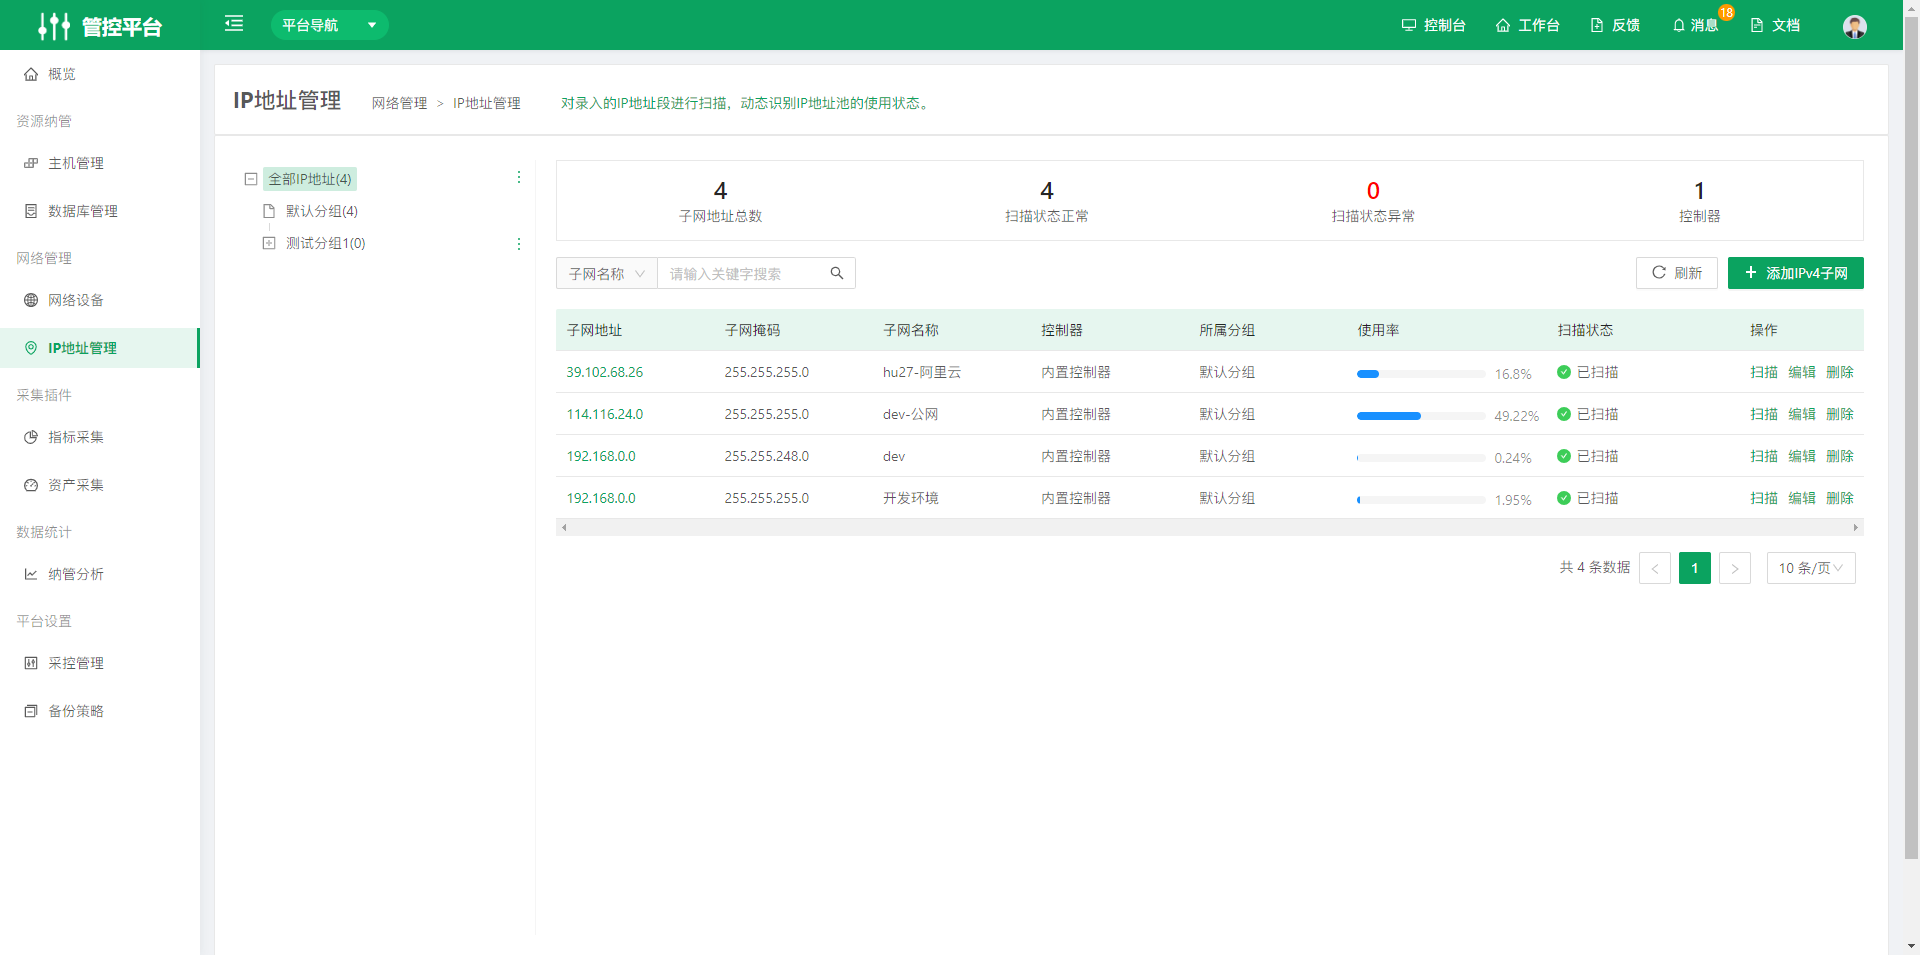
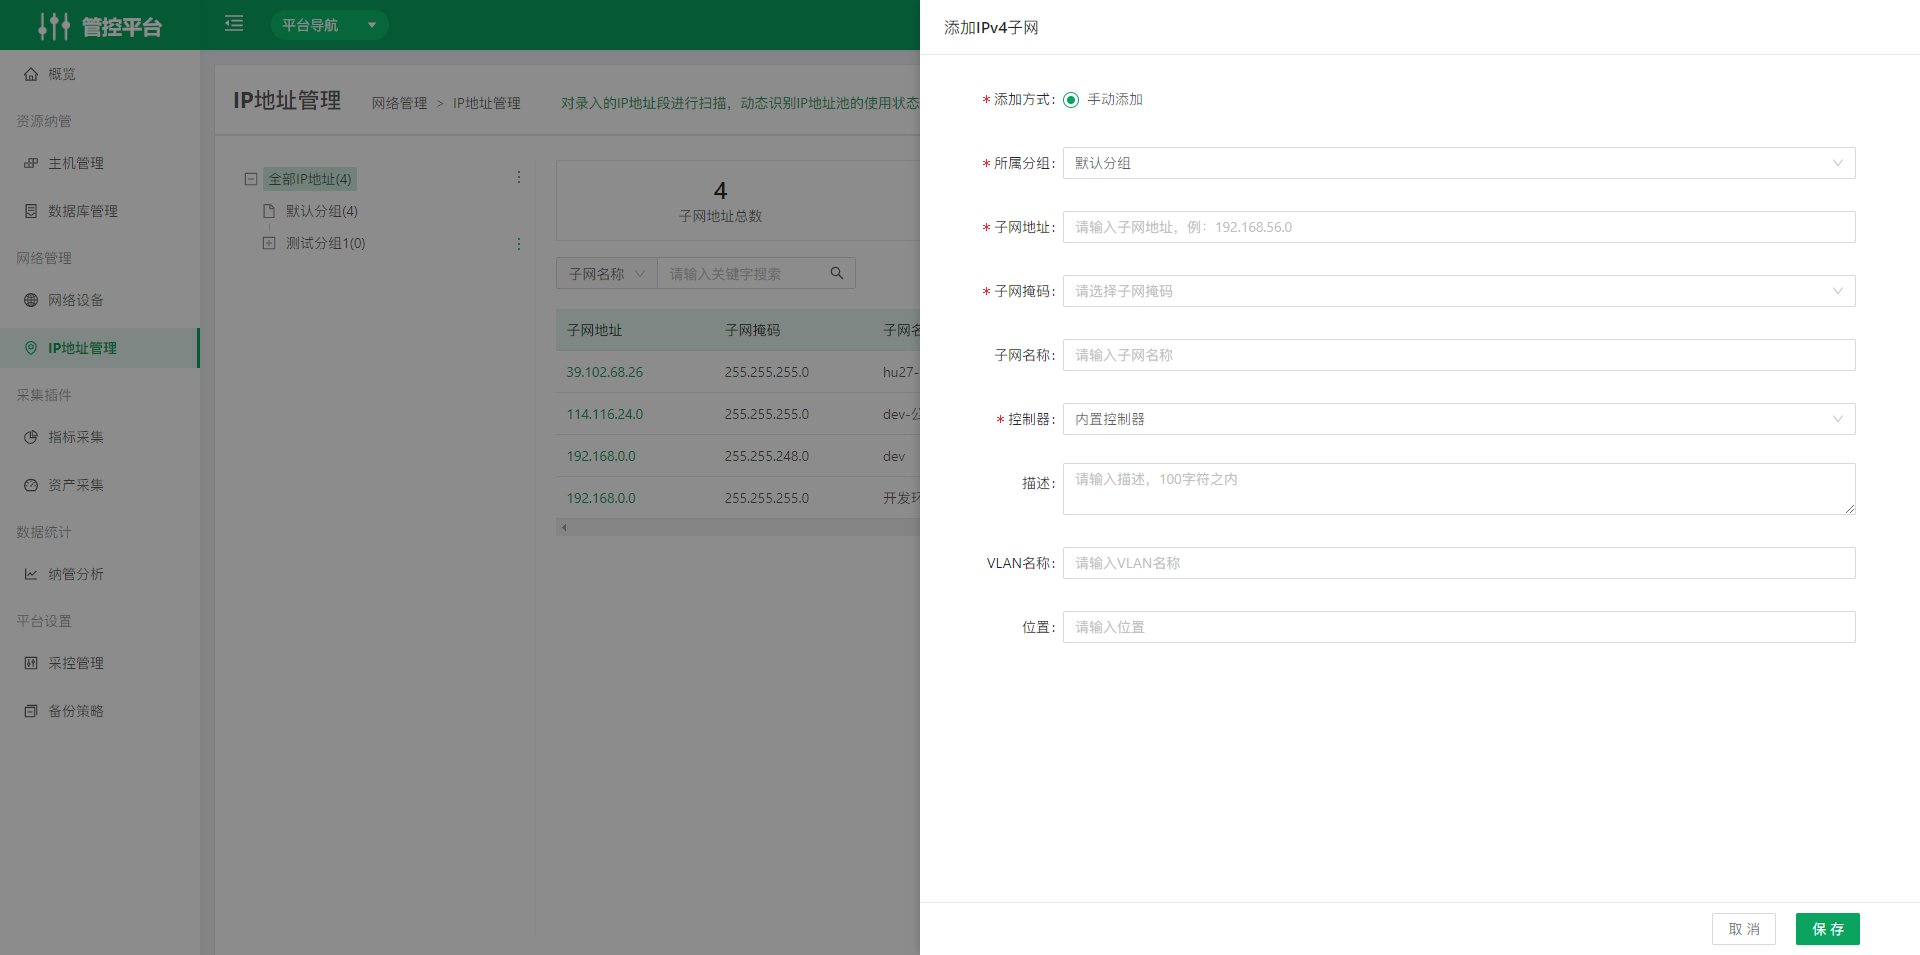
- Click Add IPv4 Subnet in the upper right corner of the page. After the Add IPv4 Subnet page opens, complete the fields on the page to create the subnet.
3. Collection Plugins
3.1 Metric Collection
Metric collection plugins support Zabbix, Prometheus Exporter, and others, and are used to collect monitoring metrics.
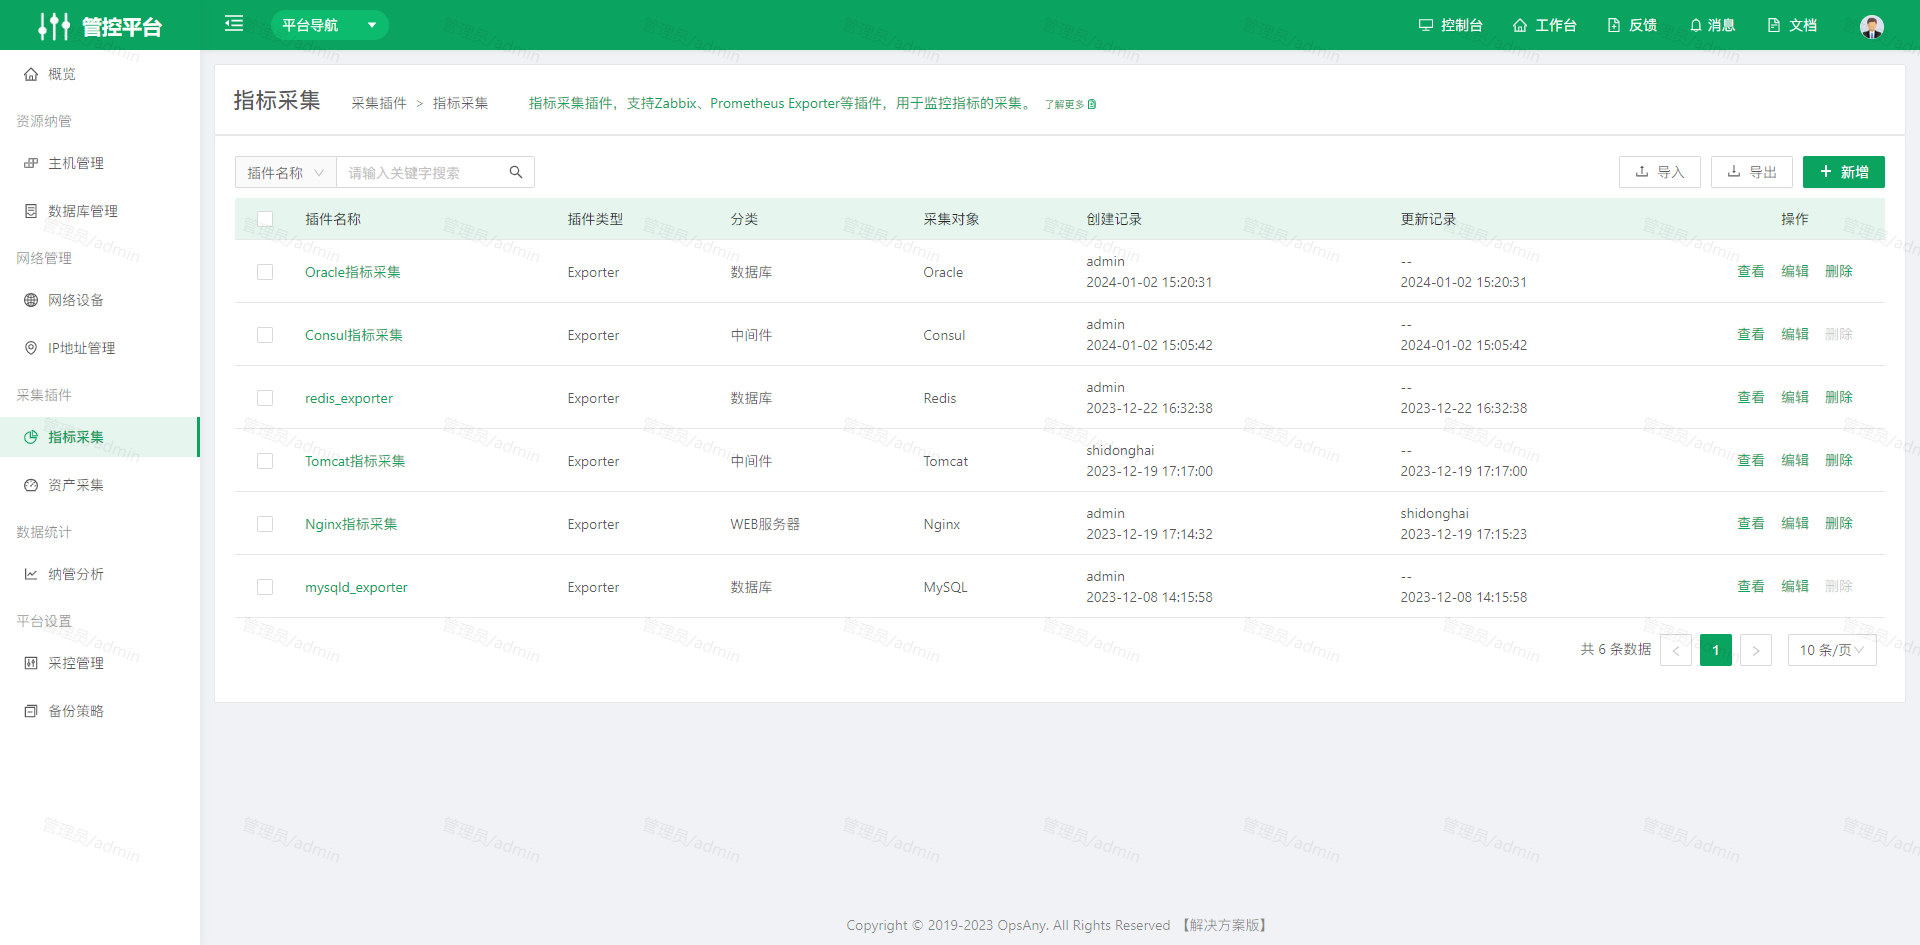
Metric collection supports import and export.
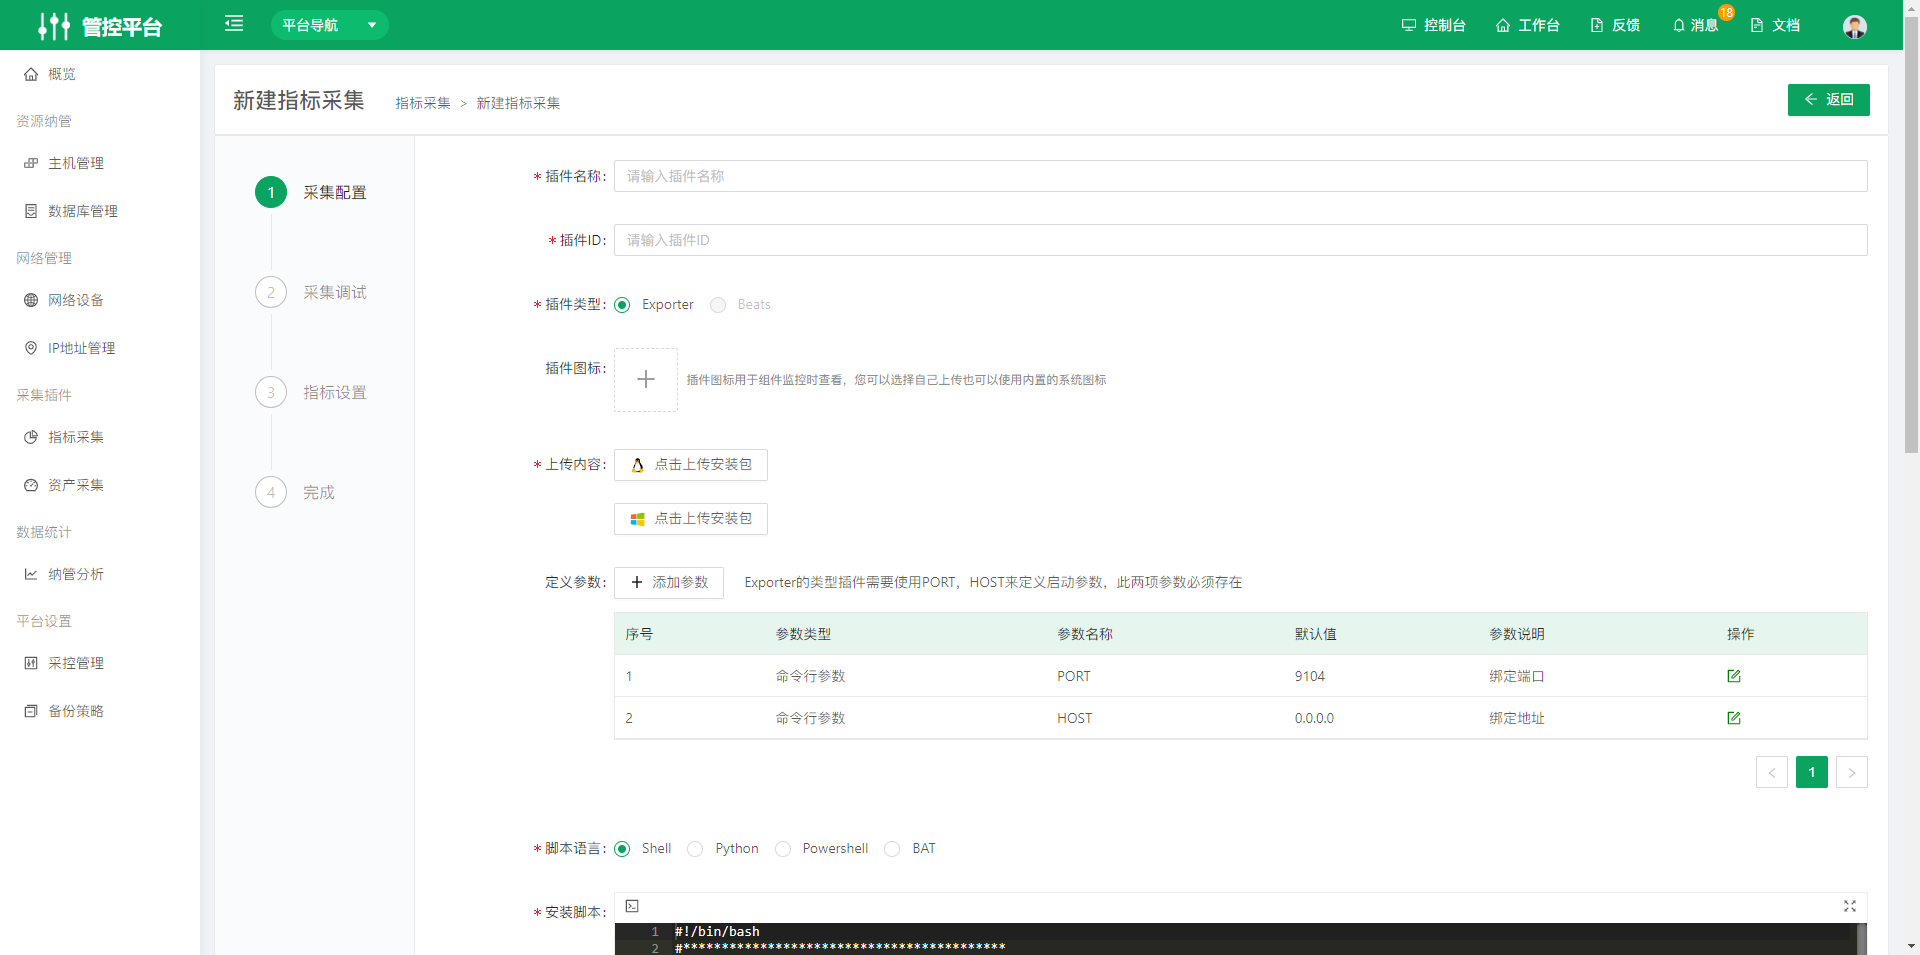
- Click Create in the upper right corner of the page. After the New Metric Collection page opens, complete the relevant fields on the page to create the plugin.
3.2 Asset Collection
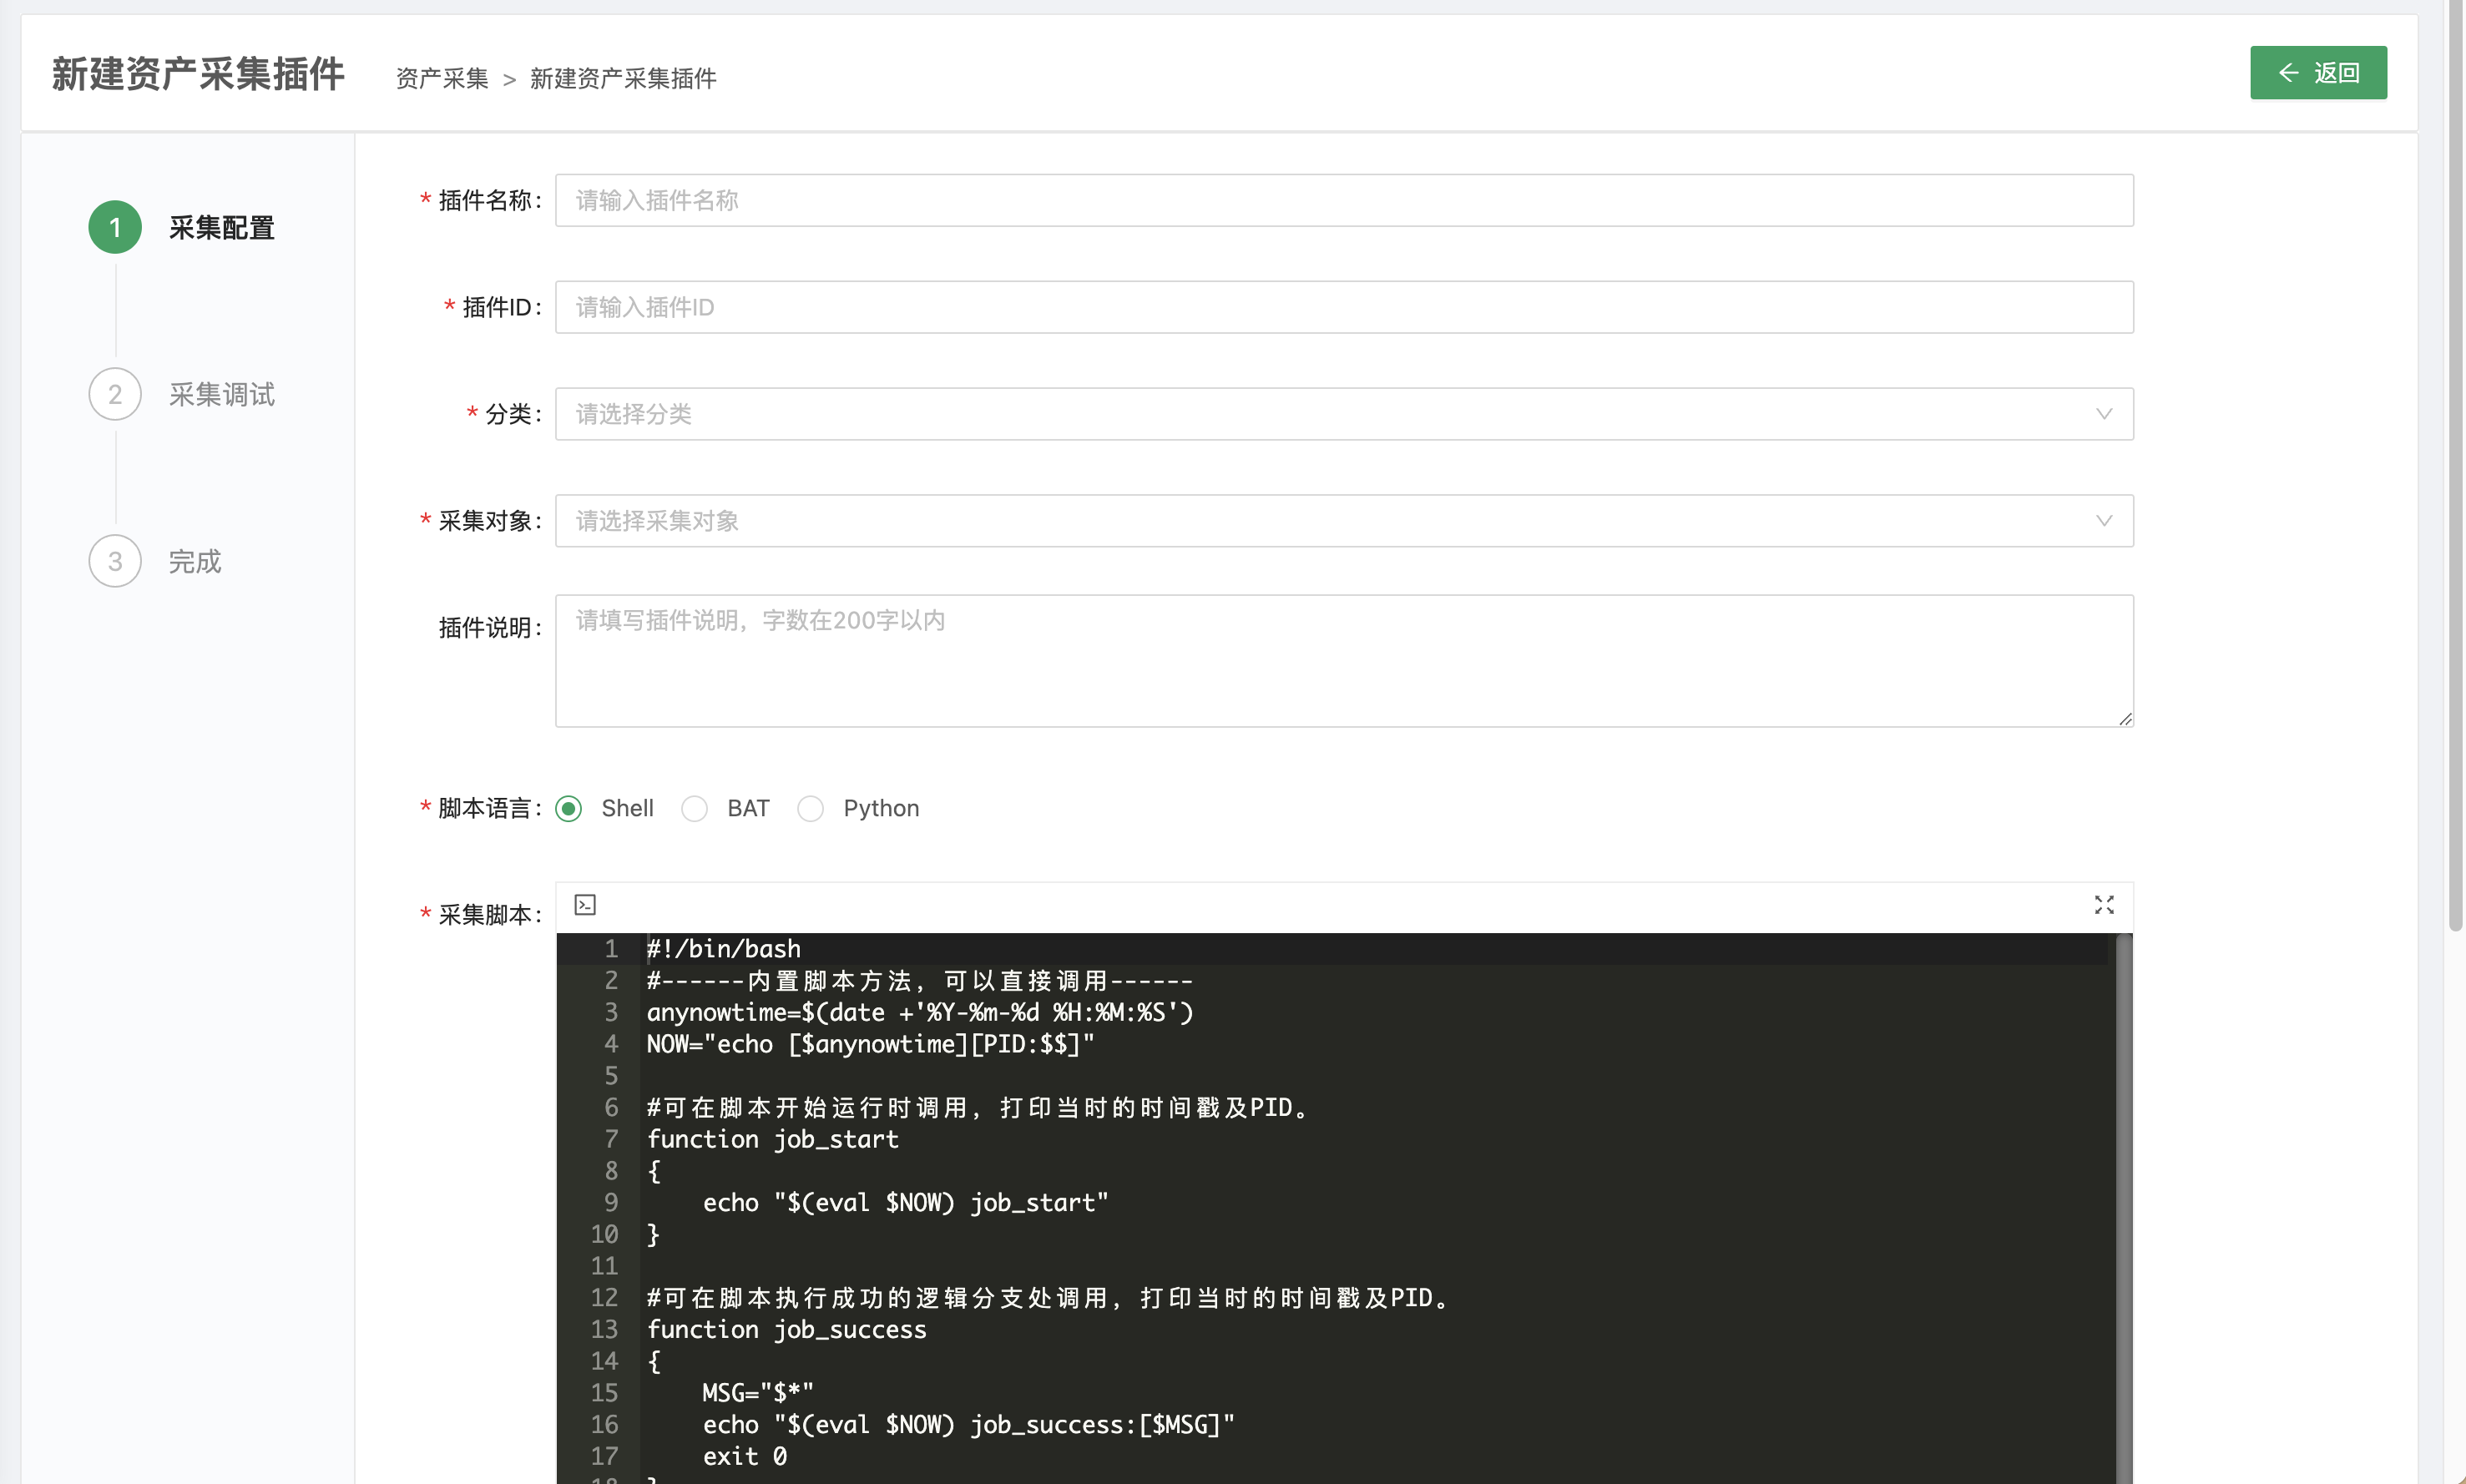
Asset collection plugins are used for automatic asset discovery and are recorded automatically through collection jobs. Plugins support import and export. Supported scripting languages are Python, Bat, and Shell.
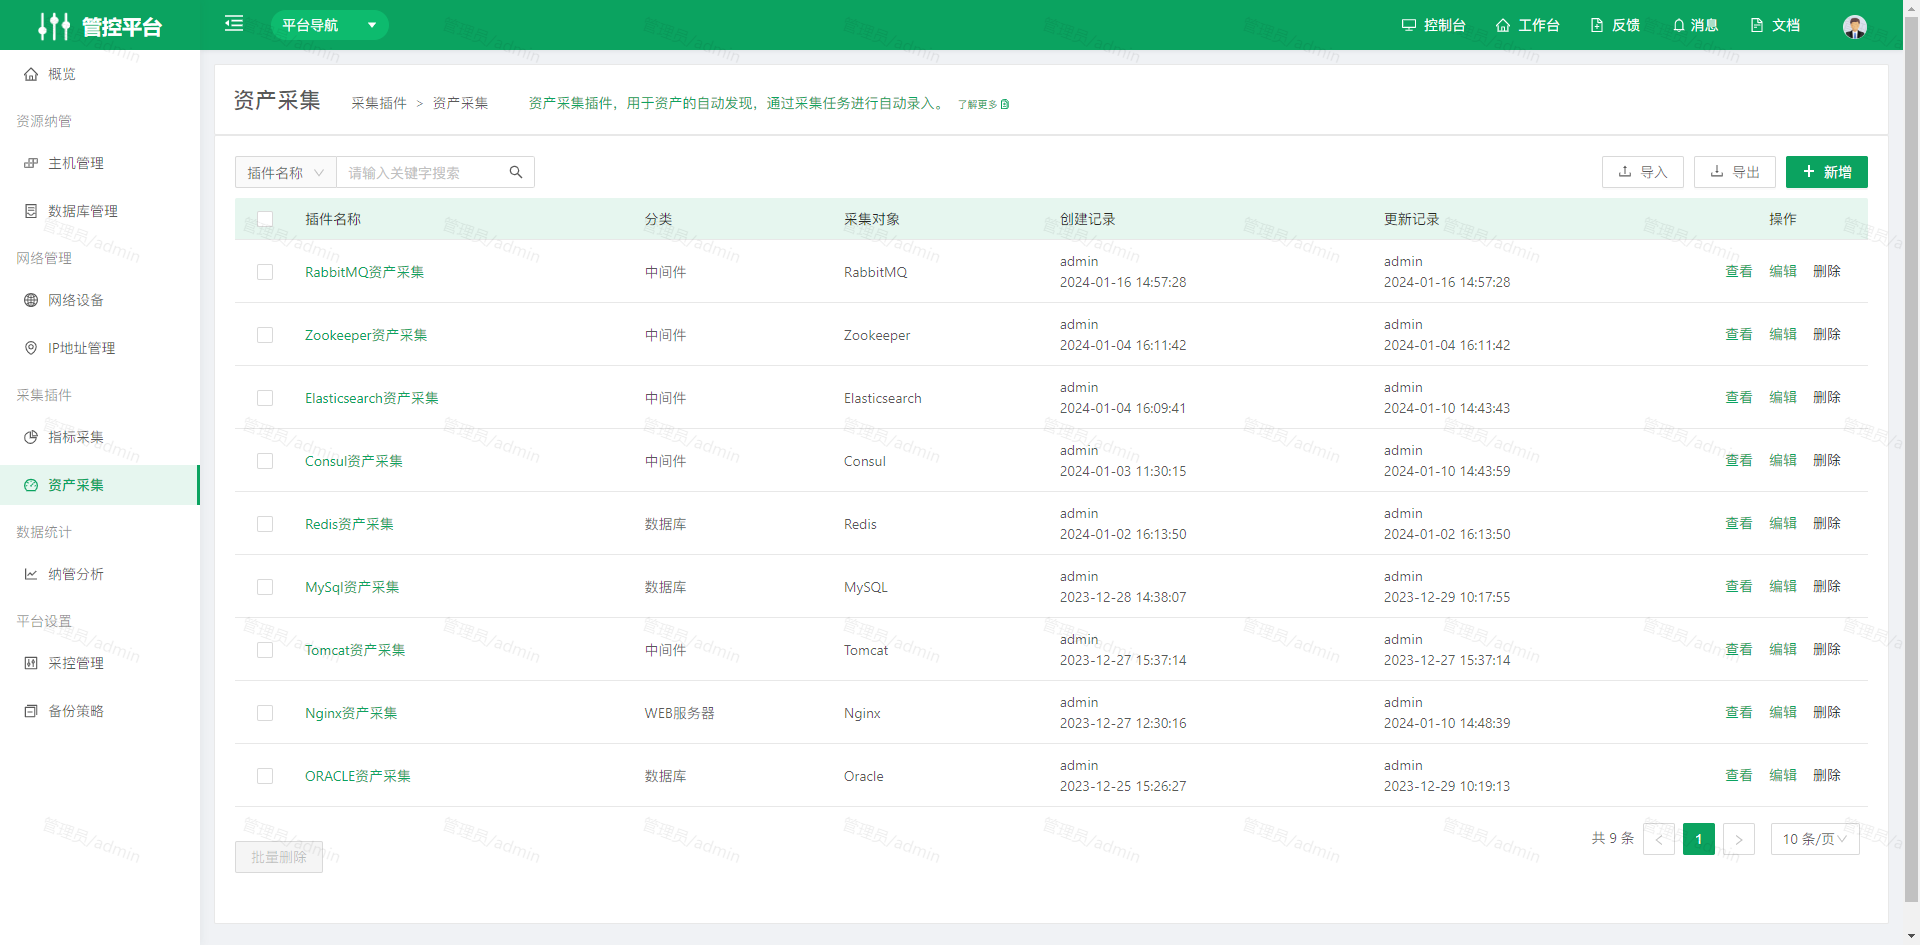
Create an asset collection
Step 1: Collection configuration
Step 2: Collection debugging
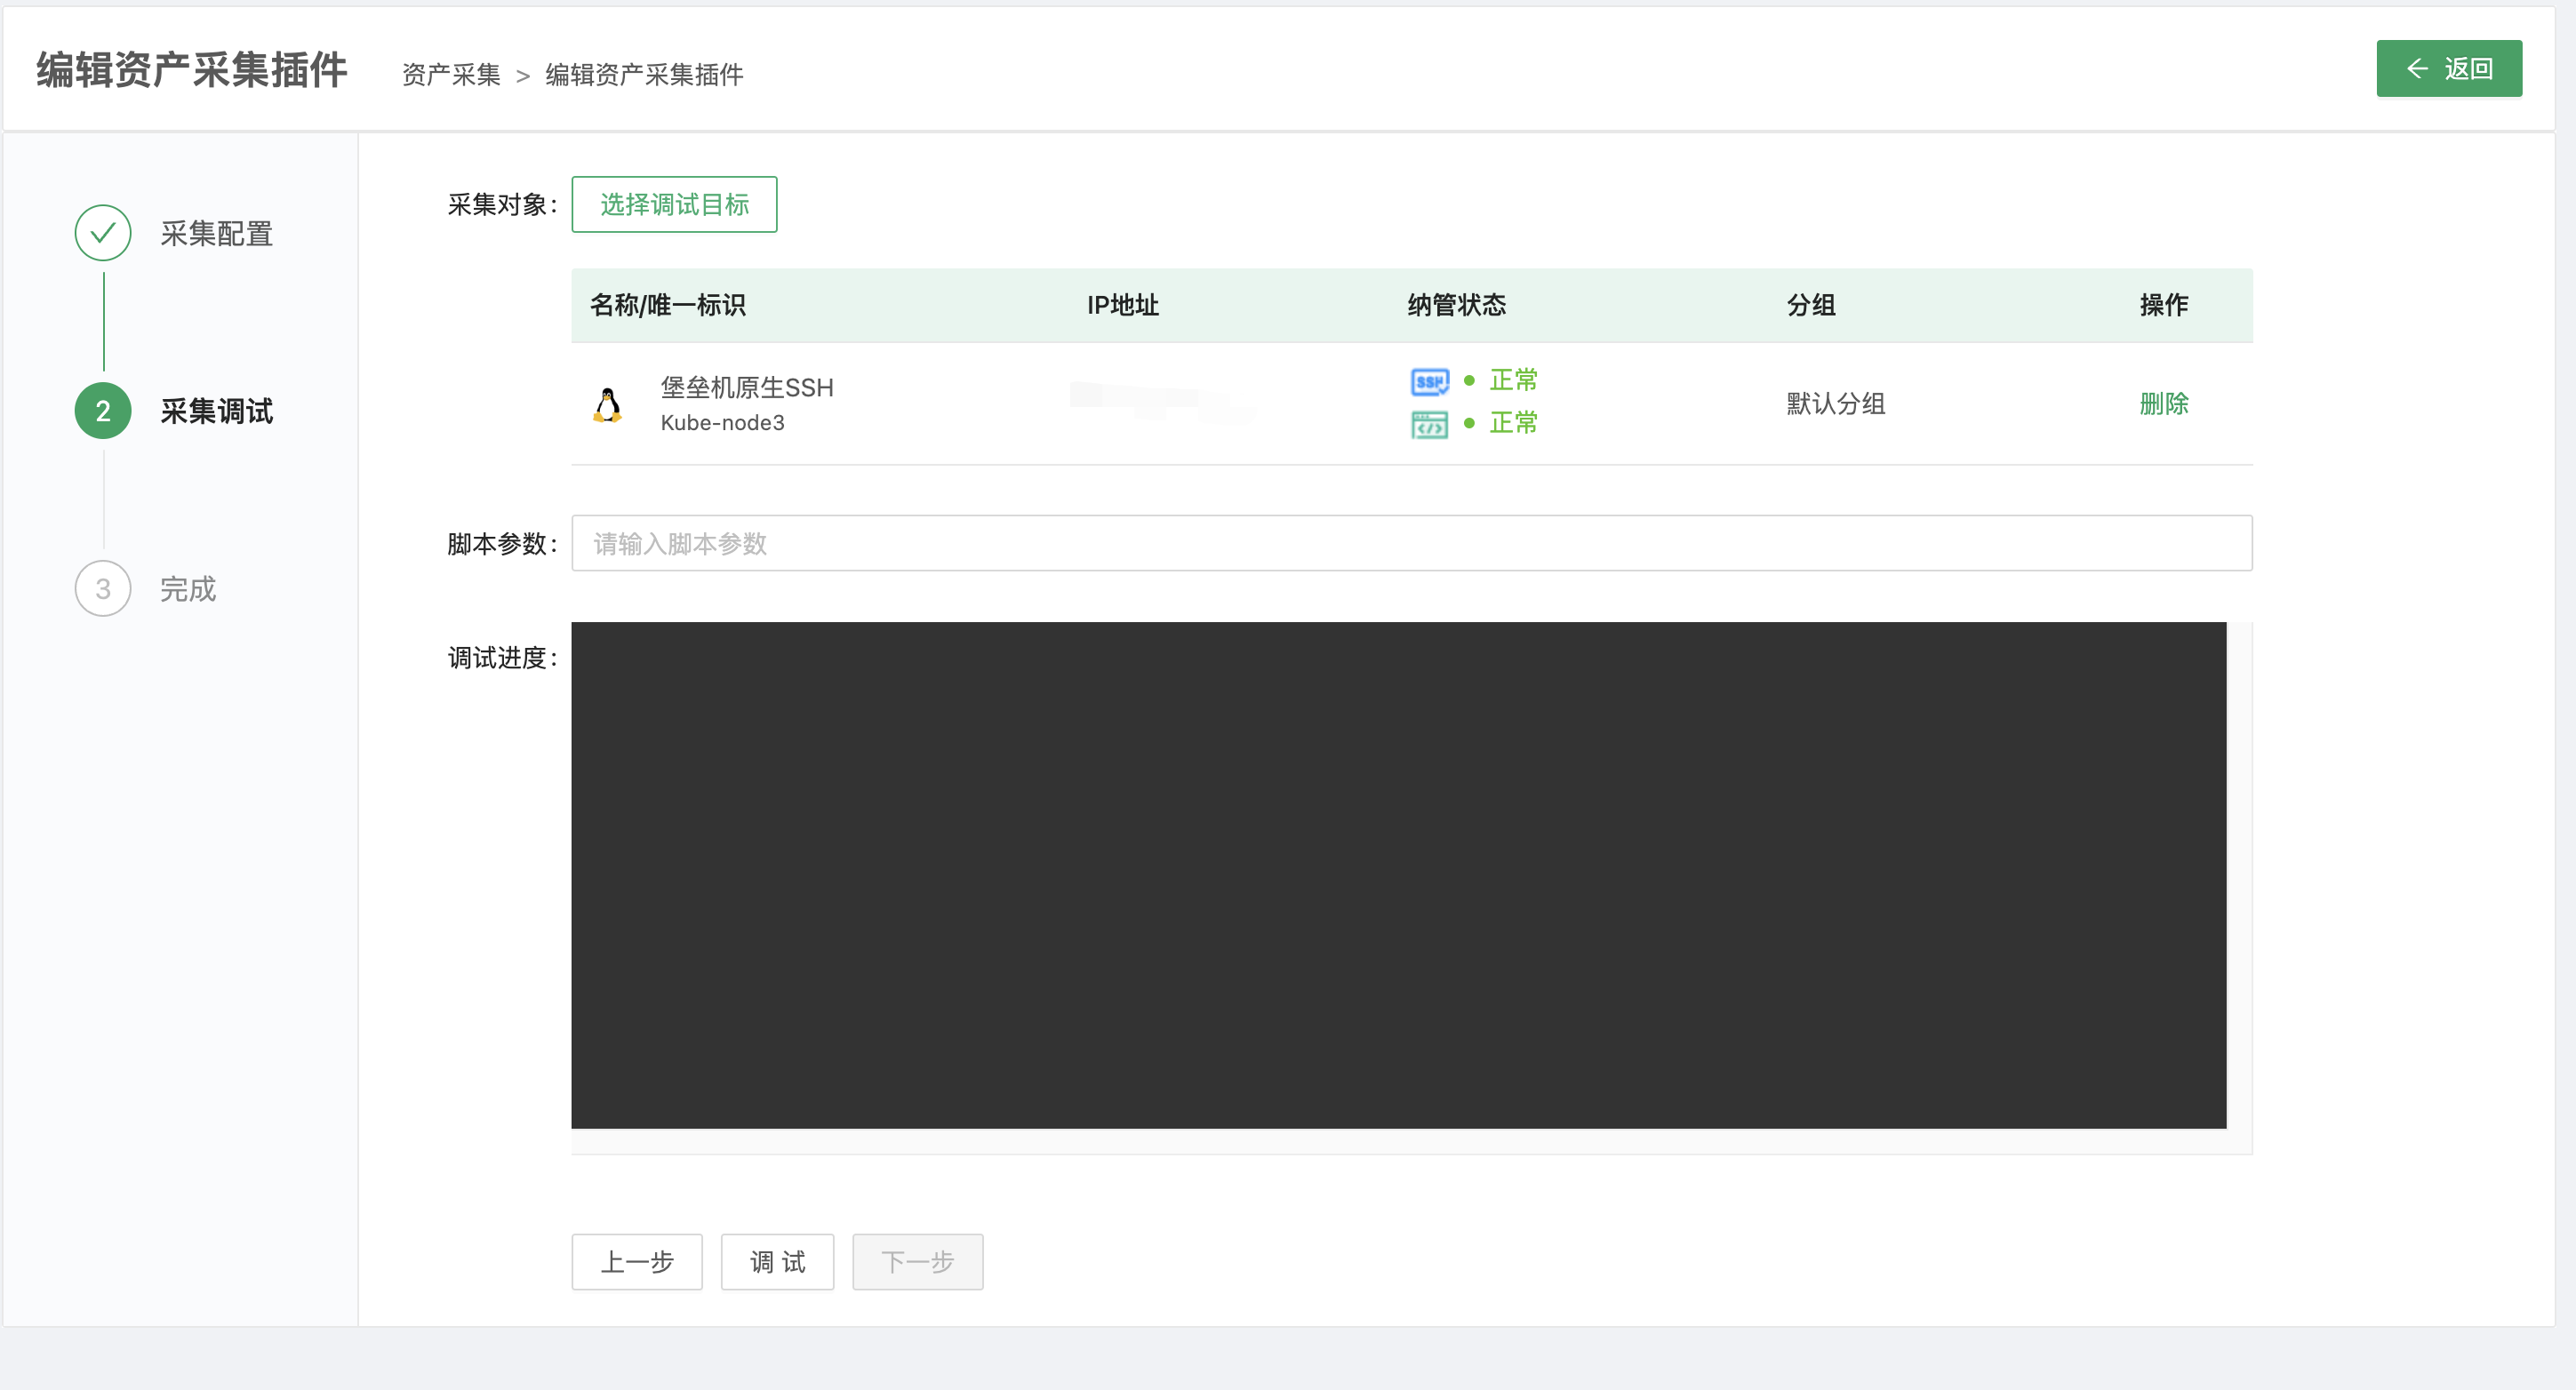
The debugging result is evaluated here. If debugging fails, you cannot continue. Debug the collection plugin carefully, or creation will fail.
4. Data Statistics
4.1 Onboarding Analysis
Onboarding Analysis analyzes resource onboarding across multiple platforms, identifies abnormal data, and helps administrators with data operations. You can examine data management gaps from different angles; for example, the difference between the Control Platform and CMDB shows which hosts are not onboarded, or do not need to be onboarded, so you can judge whether asset manageability is sufficient.
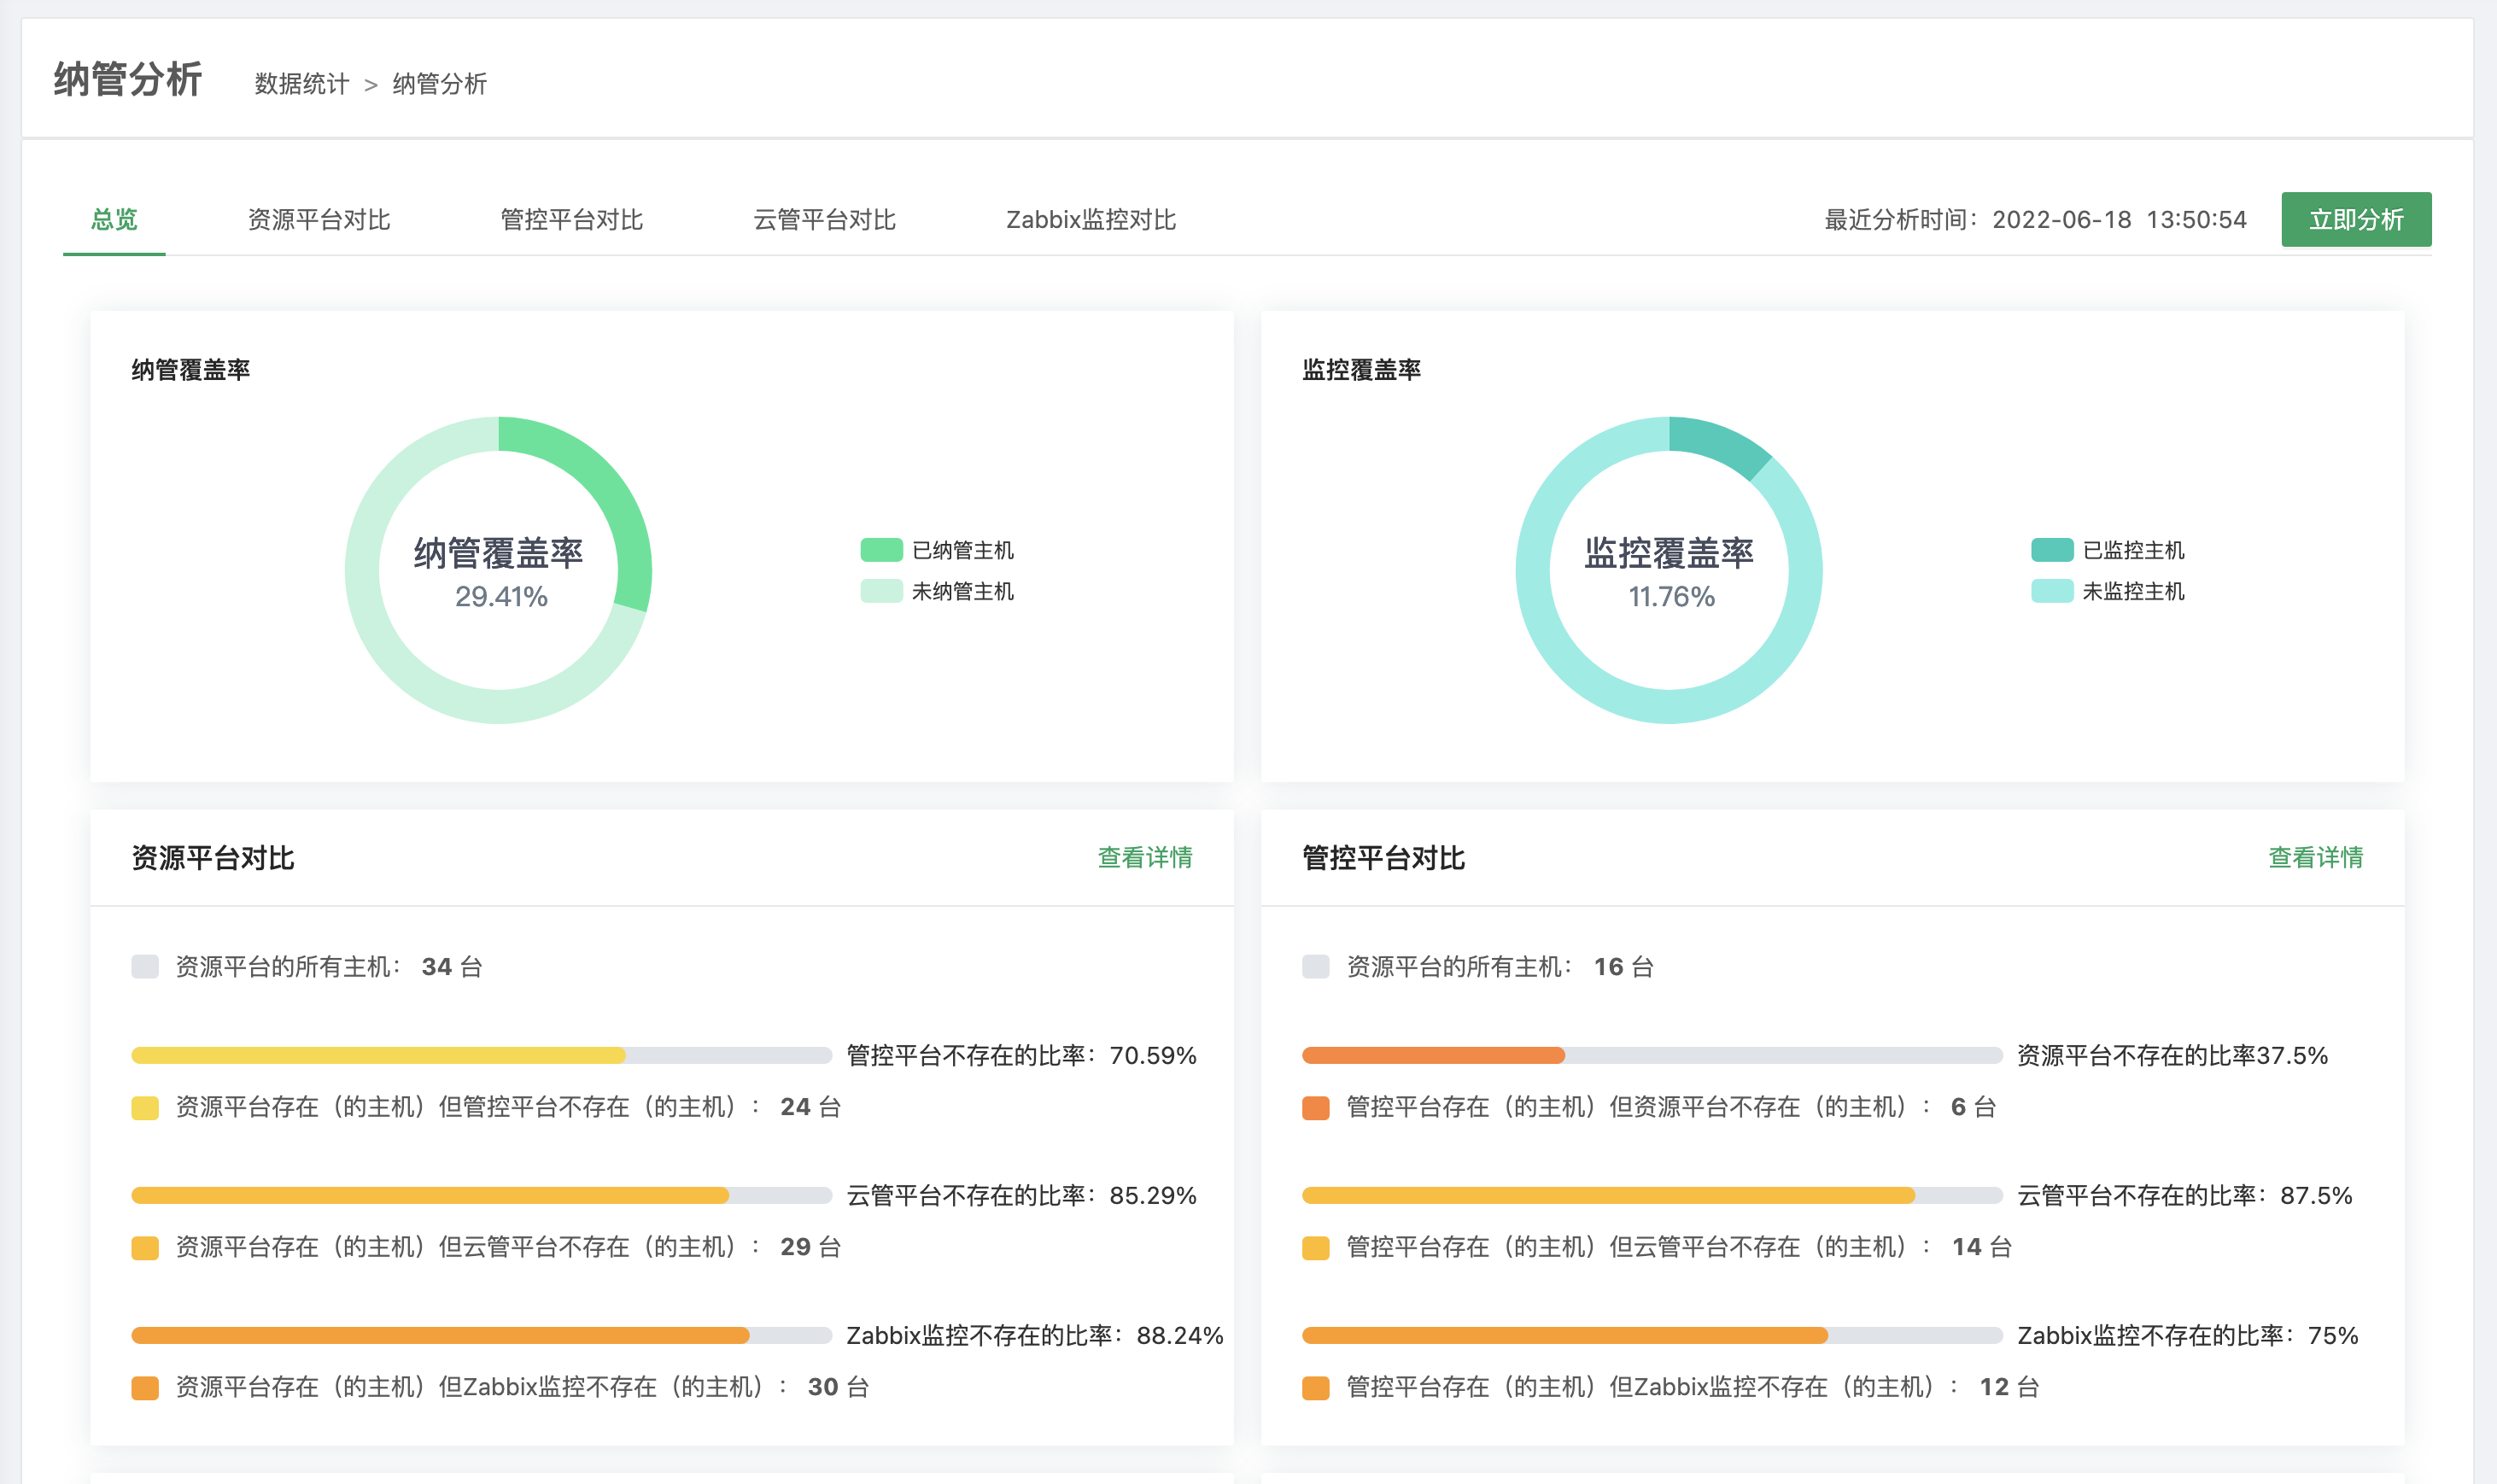
Click Analyze Now to get the final analysis result for the current data.
4.2 Background Tasks
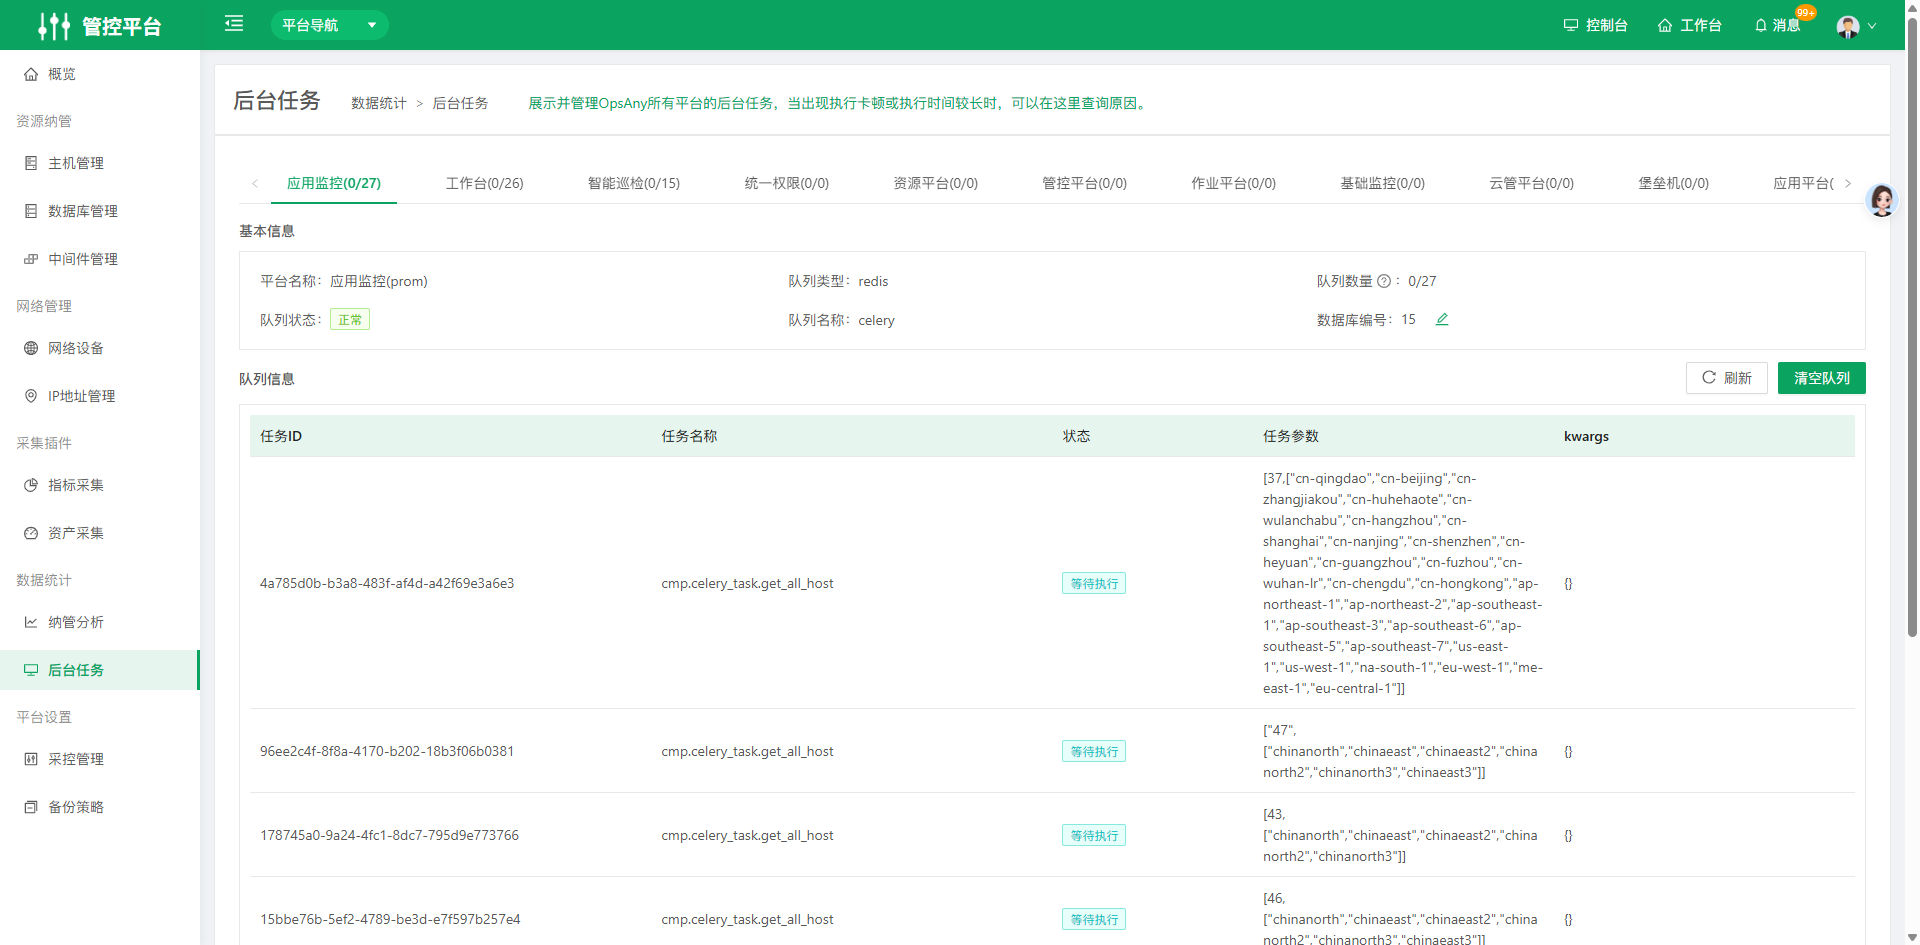
Displays and manages background tasks of all OpsAny platforms. When a task stalls or takes a long time, you can look up the cause here.
5. Platform Settings
5.1 Acquisition and Control Management
Acquisition and Control Management is the core component of the Control Platform. It currently supports Proxy controllers, Elasticsearch integration, Zabbix integration, Grafana integration, Prometheus integration, and StackStorm integration, and can run multiple Proxy controllers at the same time.
5.1.1 Controllers (Proxy)
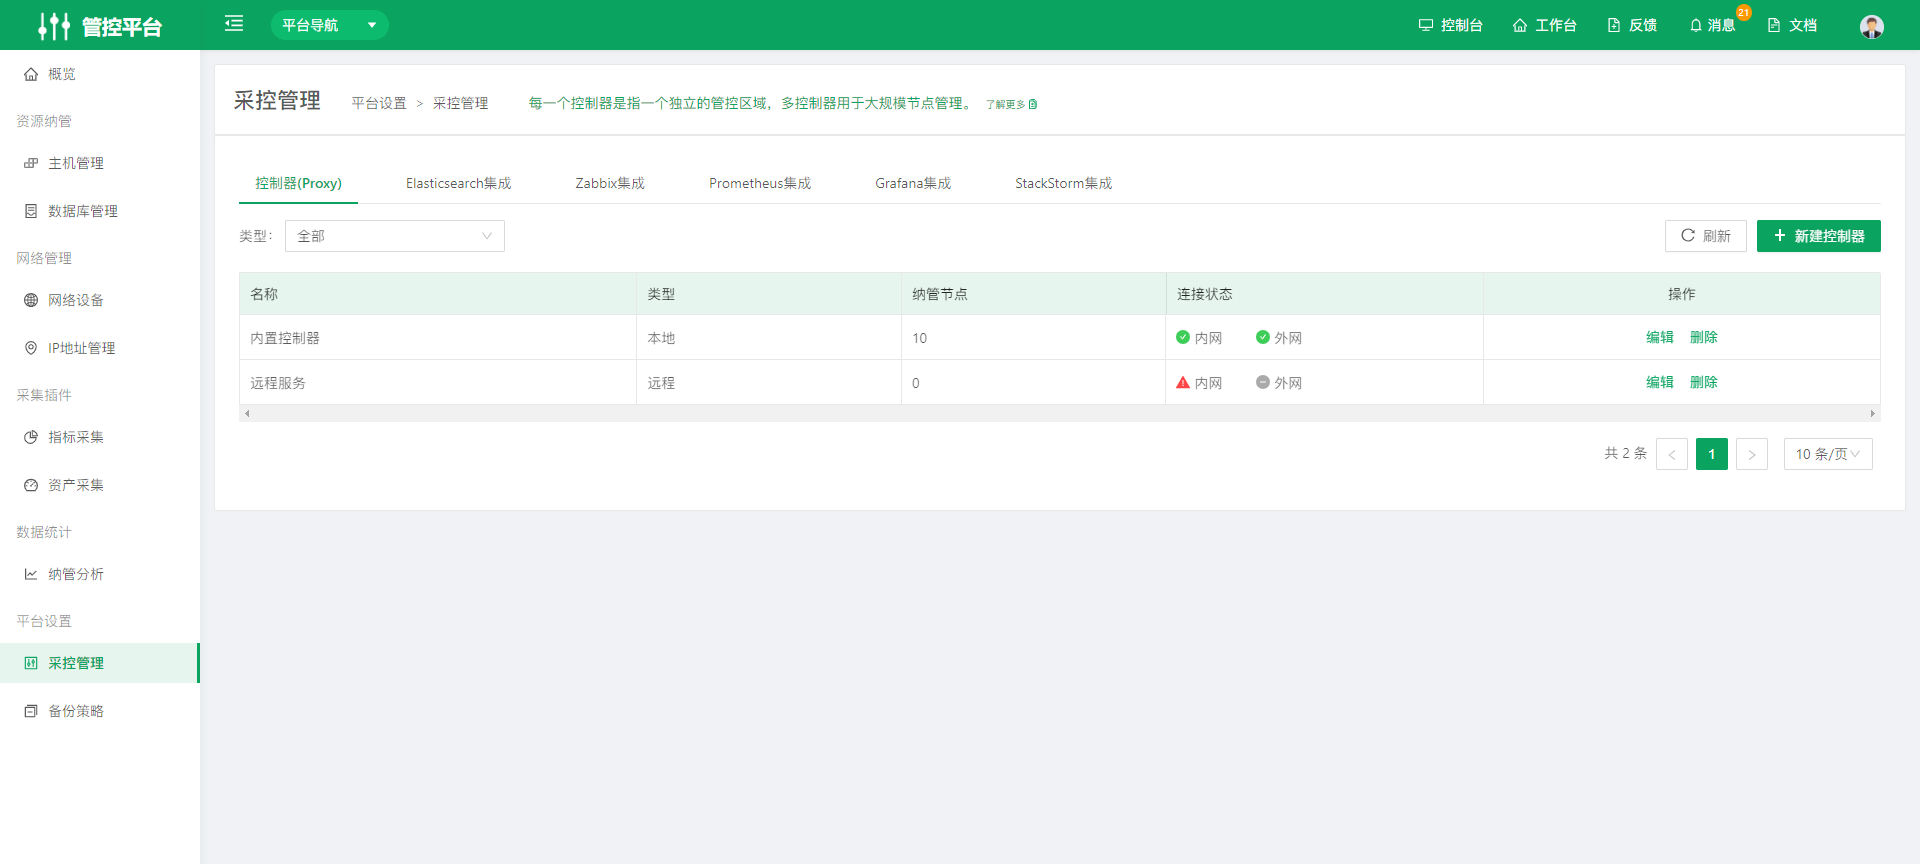
Each controller represents an independent control zone. Multiple controllers are used for large-scale node management.
Create a proxy controller
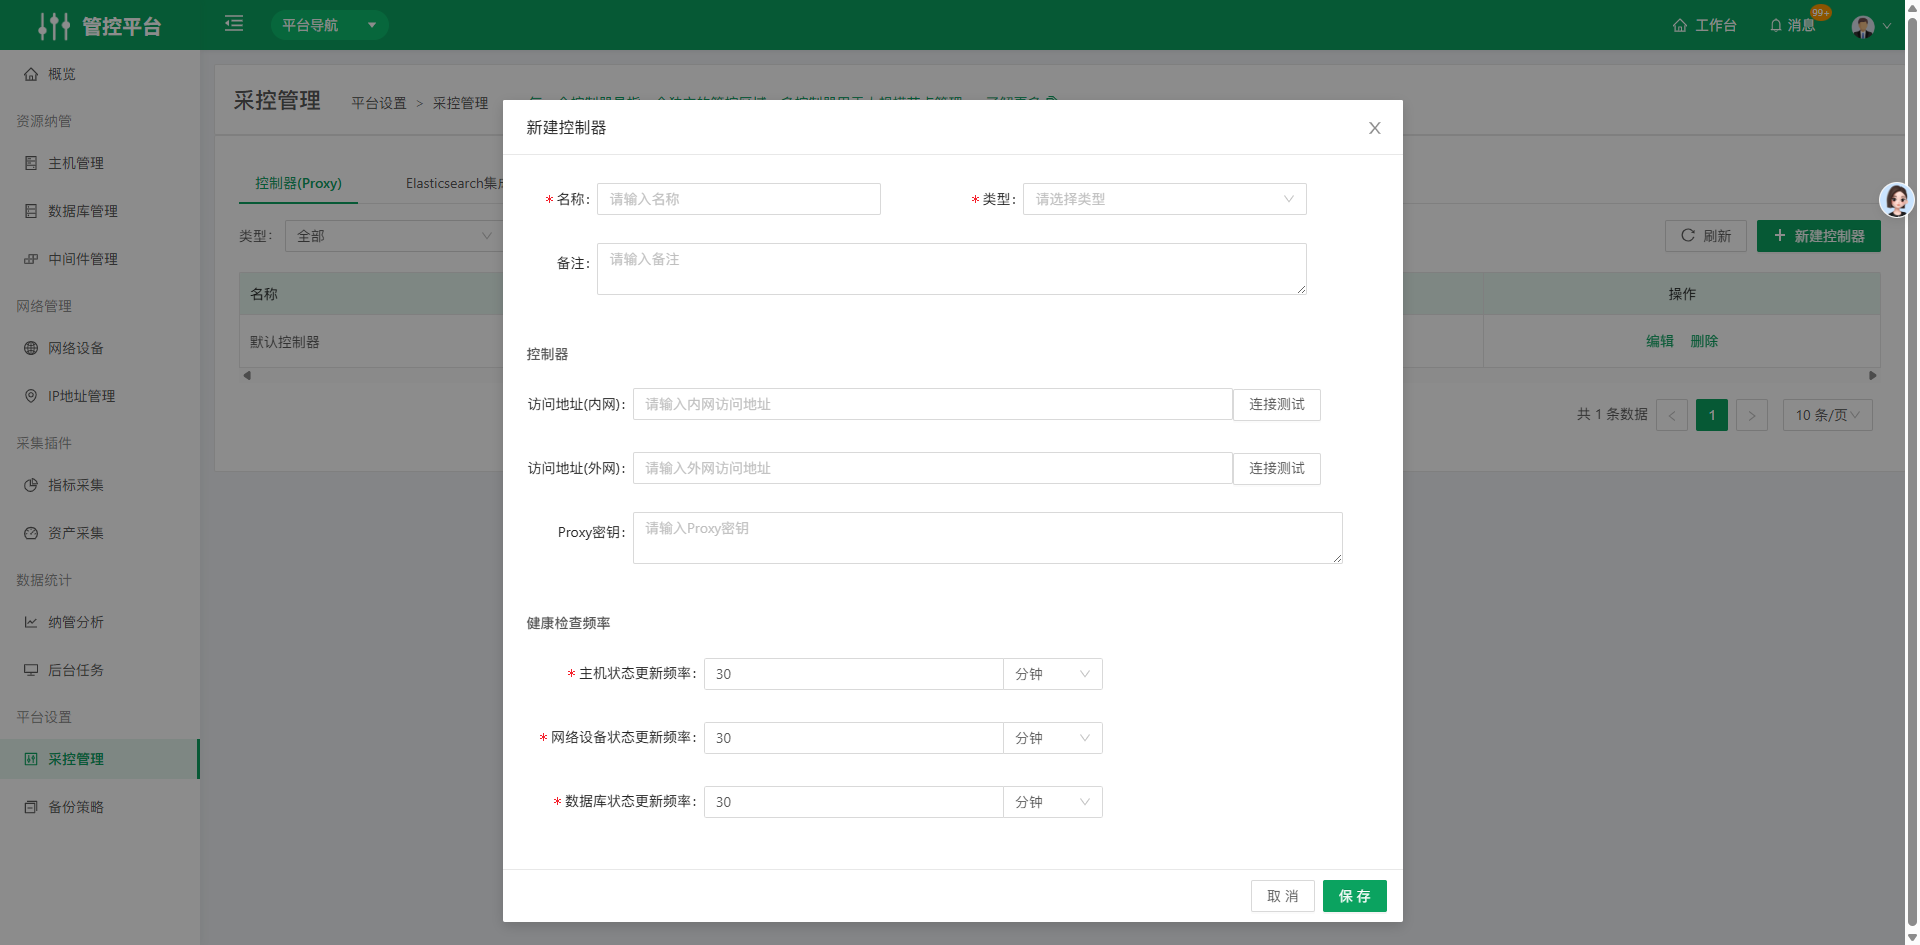
- Name: You can define the controller name.
- Type: Local and remote types are supported.
- A controller can have both an internal and an external address, so you can use it in different network environments.
- Proxy key: Each controller has a key used to verify data communication.
- Health check interval: Customize how often resource status is checked. The default is 30 minutes.
5.1.2 Elasticsearch Integration
Create an ES cluster
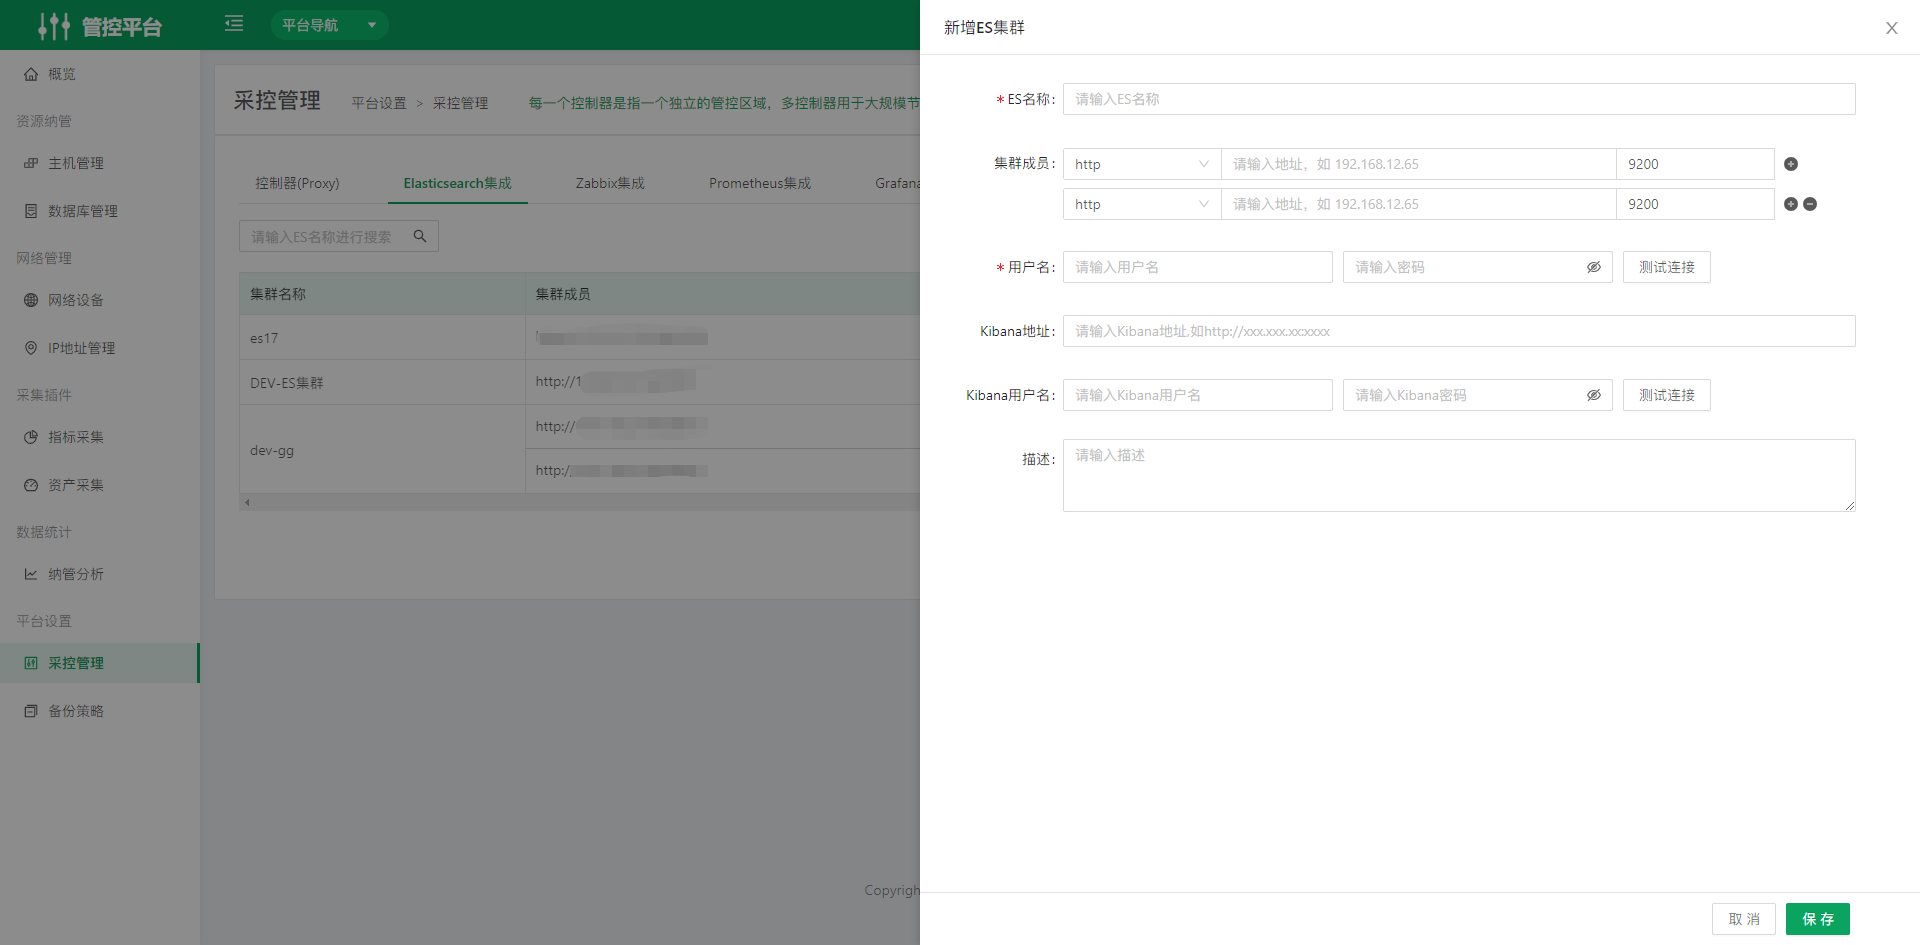
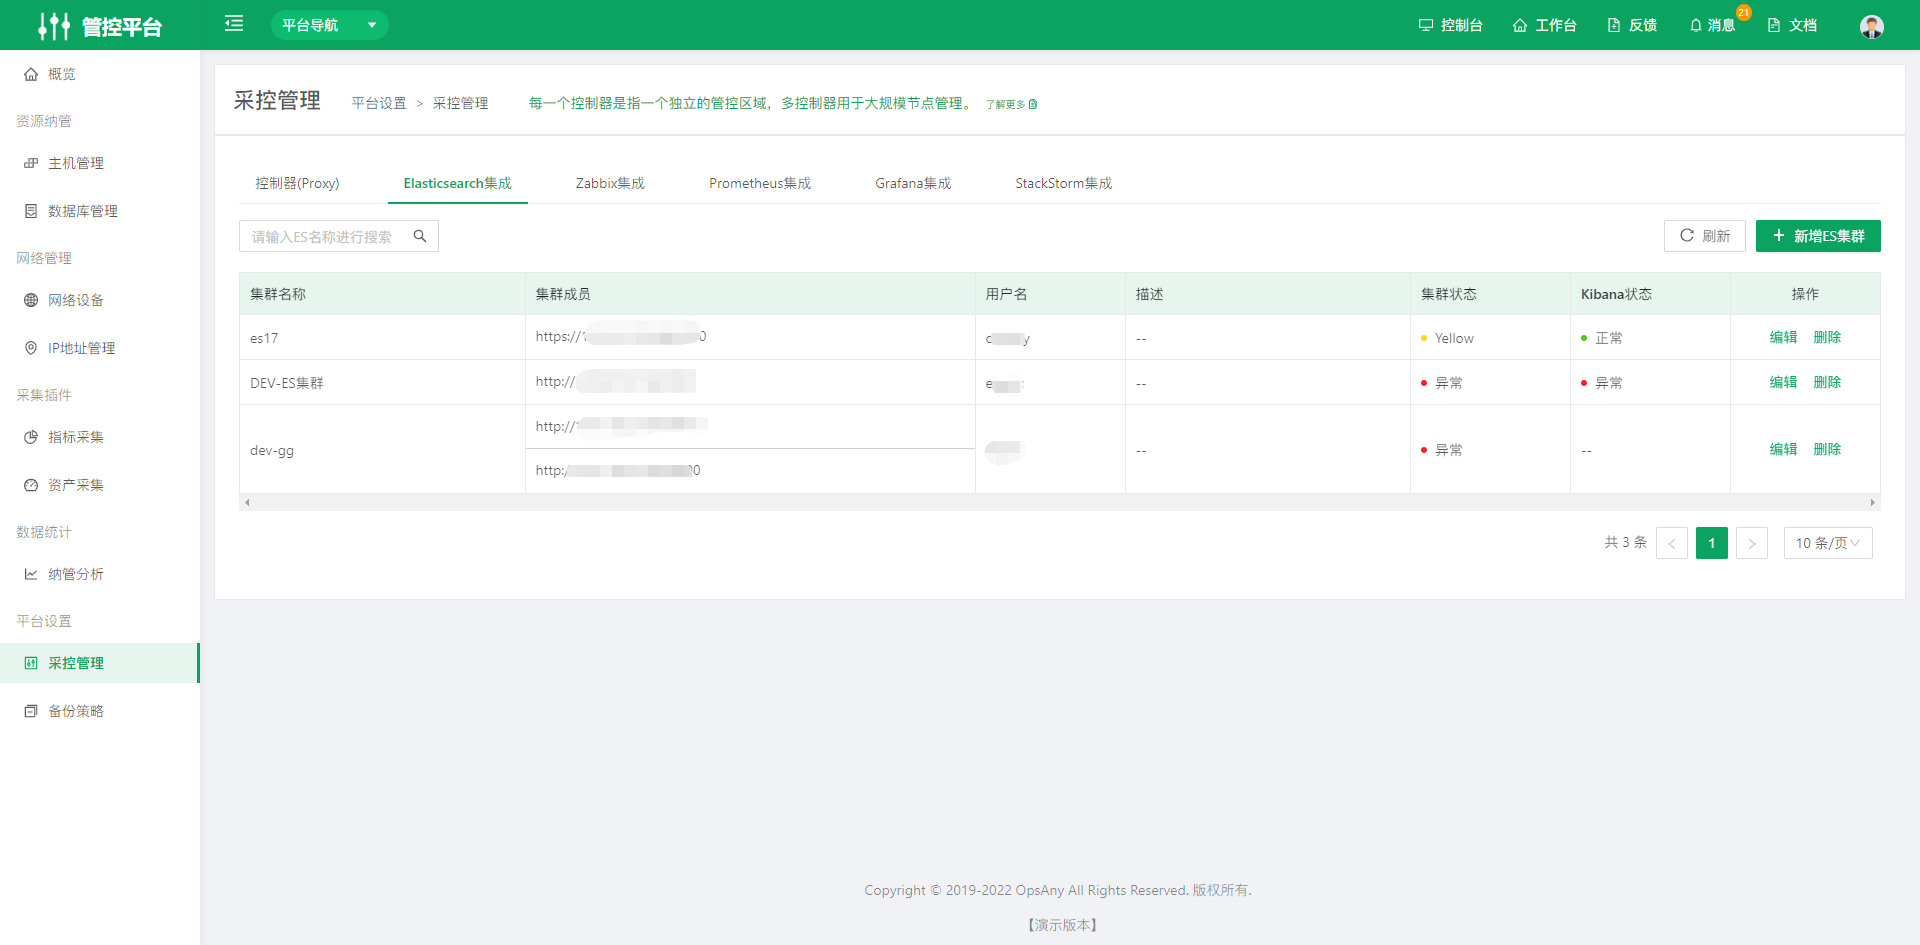
- Cluster members: Select http/https, then enter the cluster address and port. Multiple clusters can be added.
- Username: Enter the username and password, and test whether the cluster connection succeeds.
- After entering the Kibana address, username, and password, test whether the connection succeeds.
5.1.3 Zabbix Integration
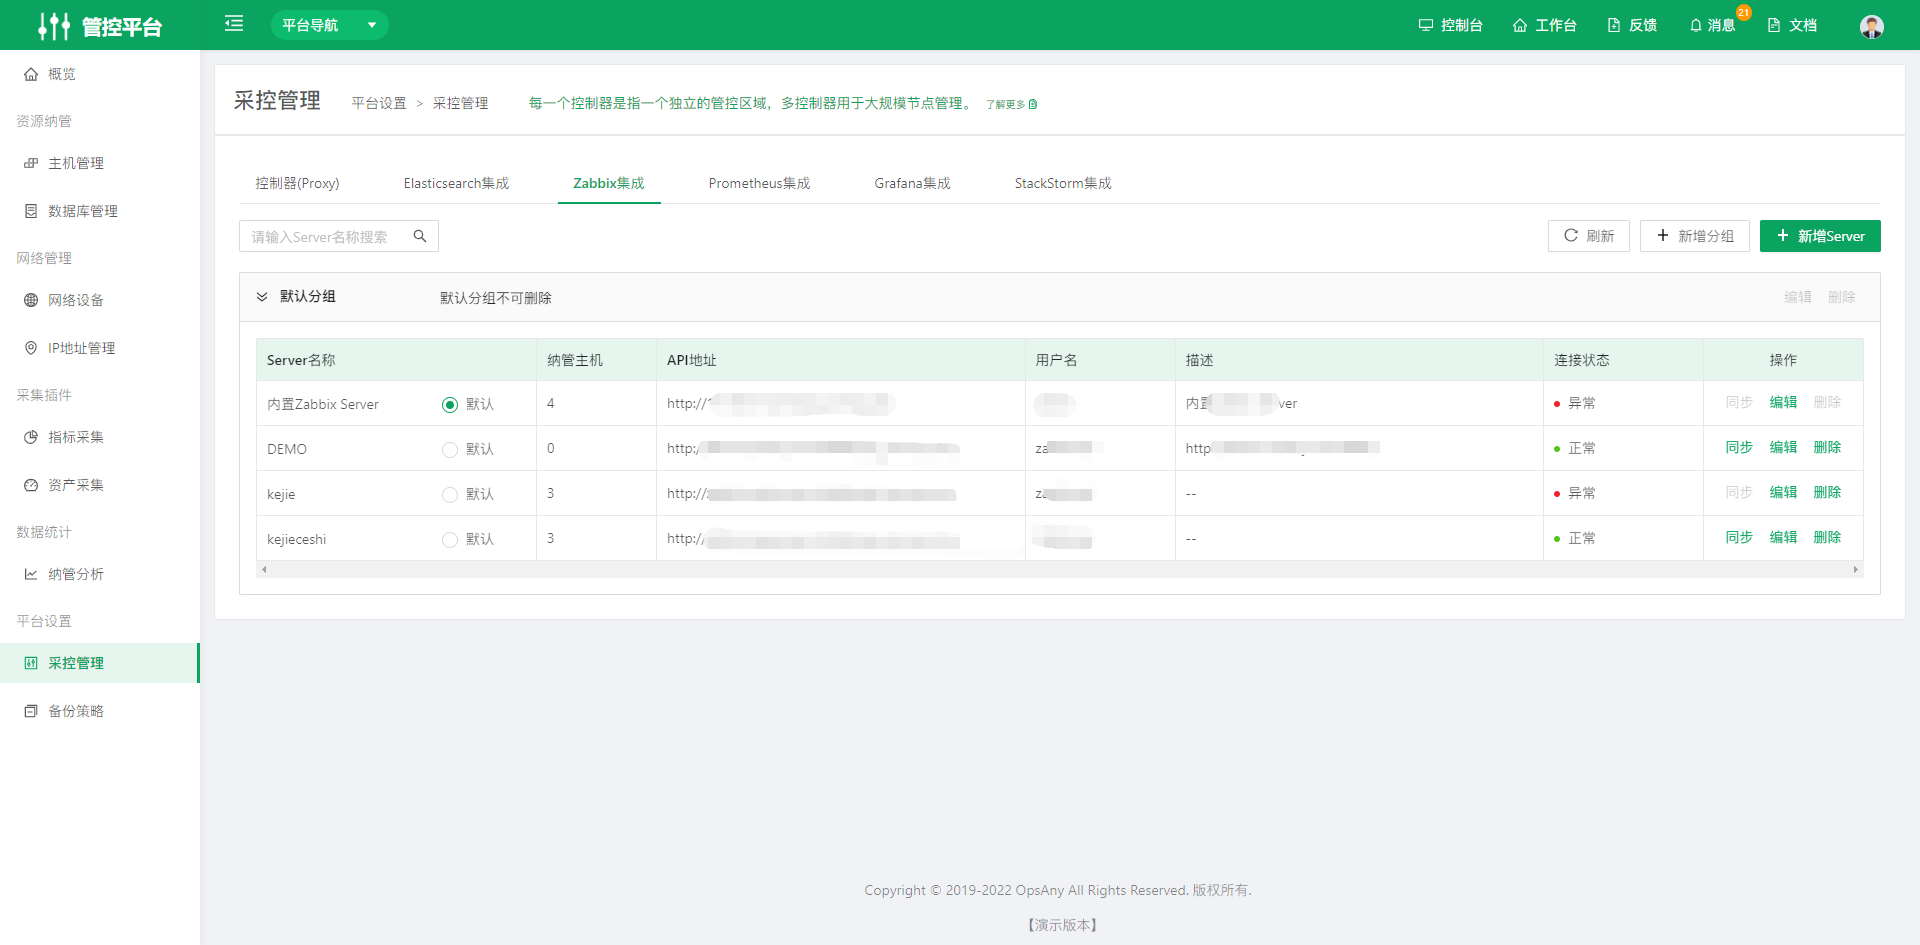
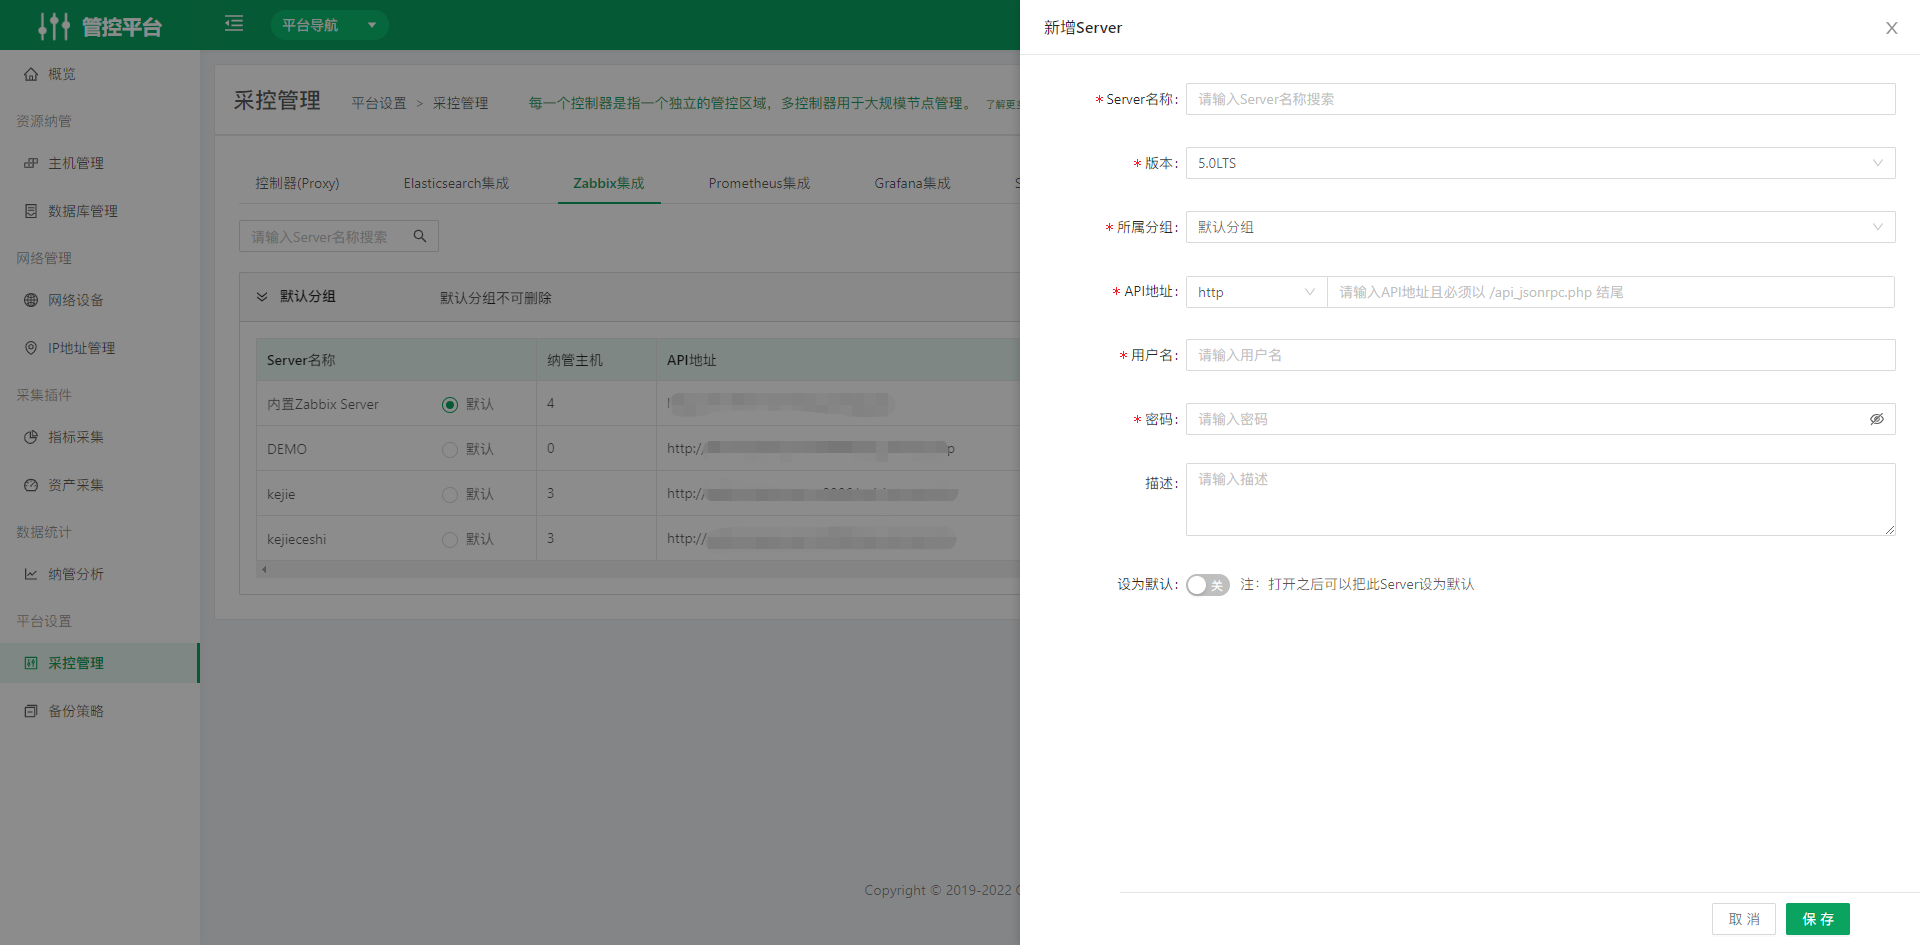
Create a Zabbix Server
Synchronize Zabbix
Synchronize Zabbix resources to Host Management and Network Device Management
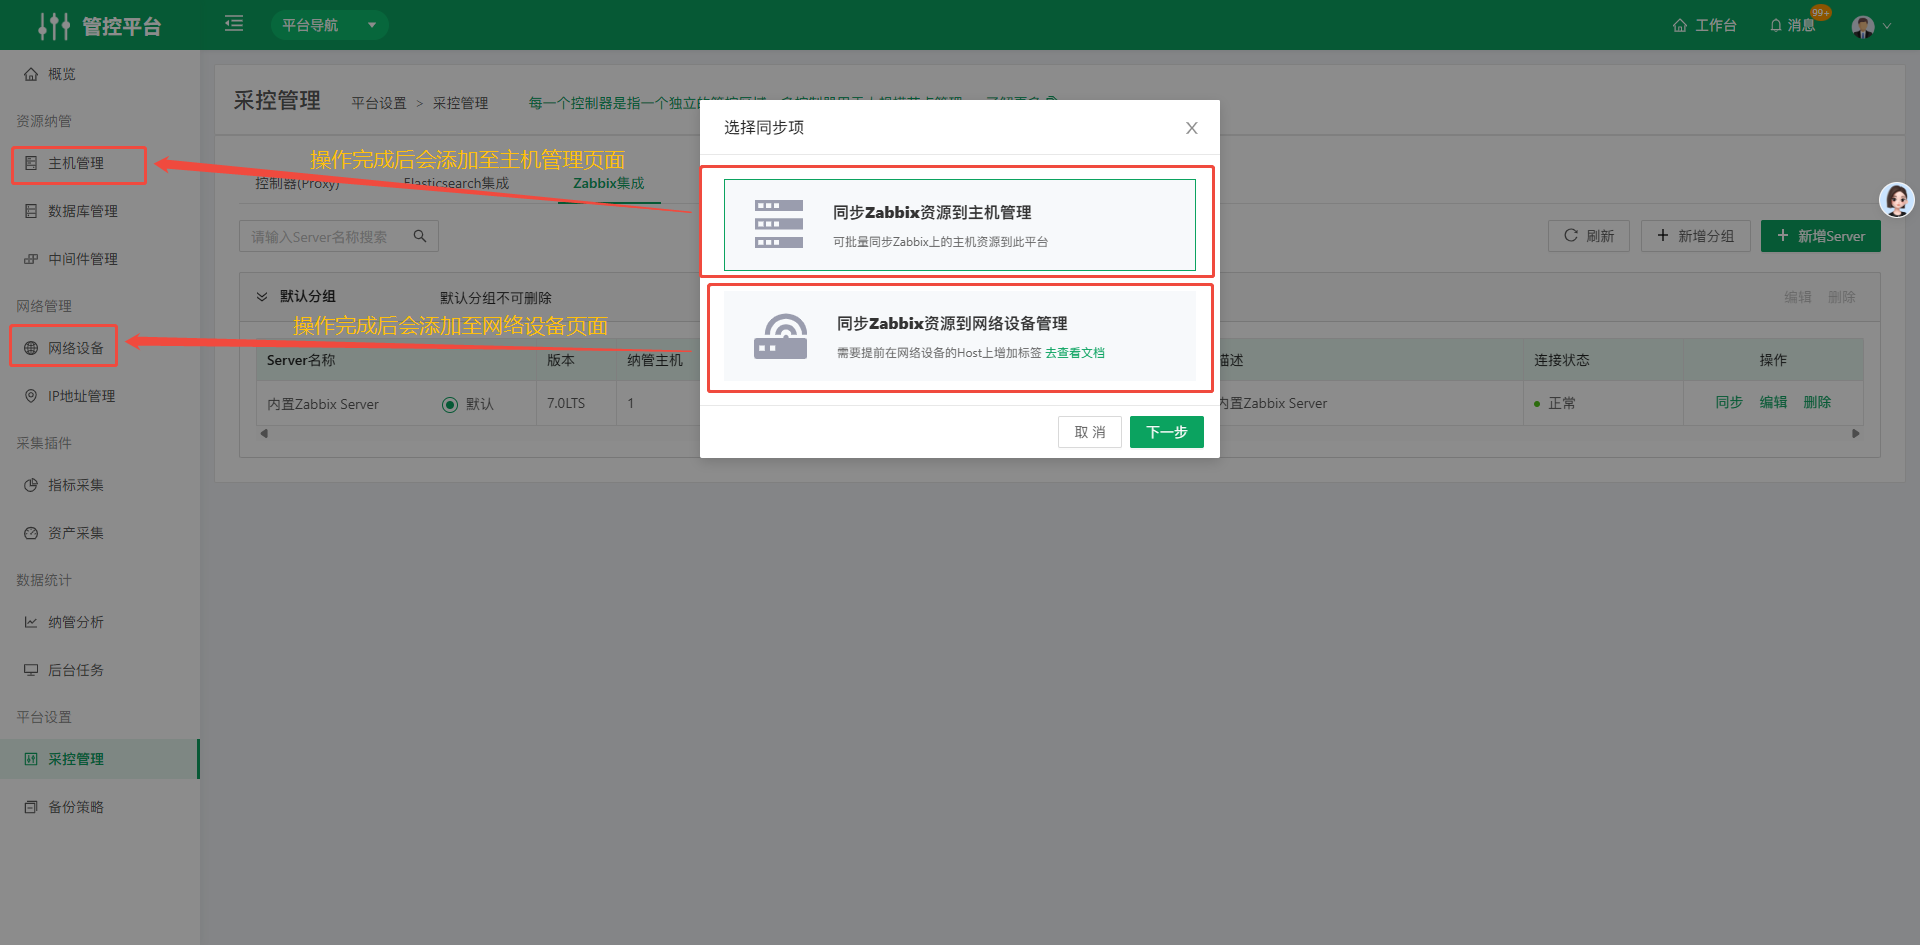
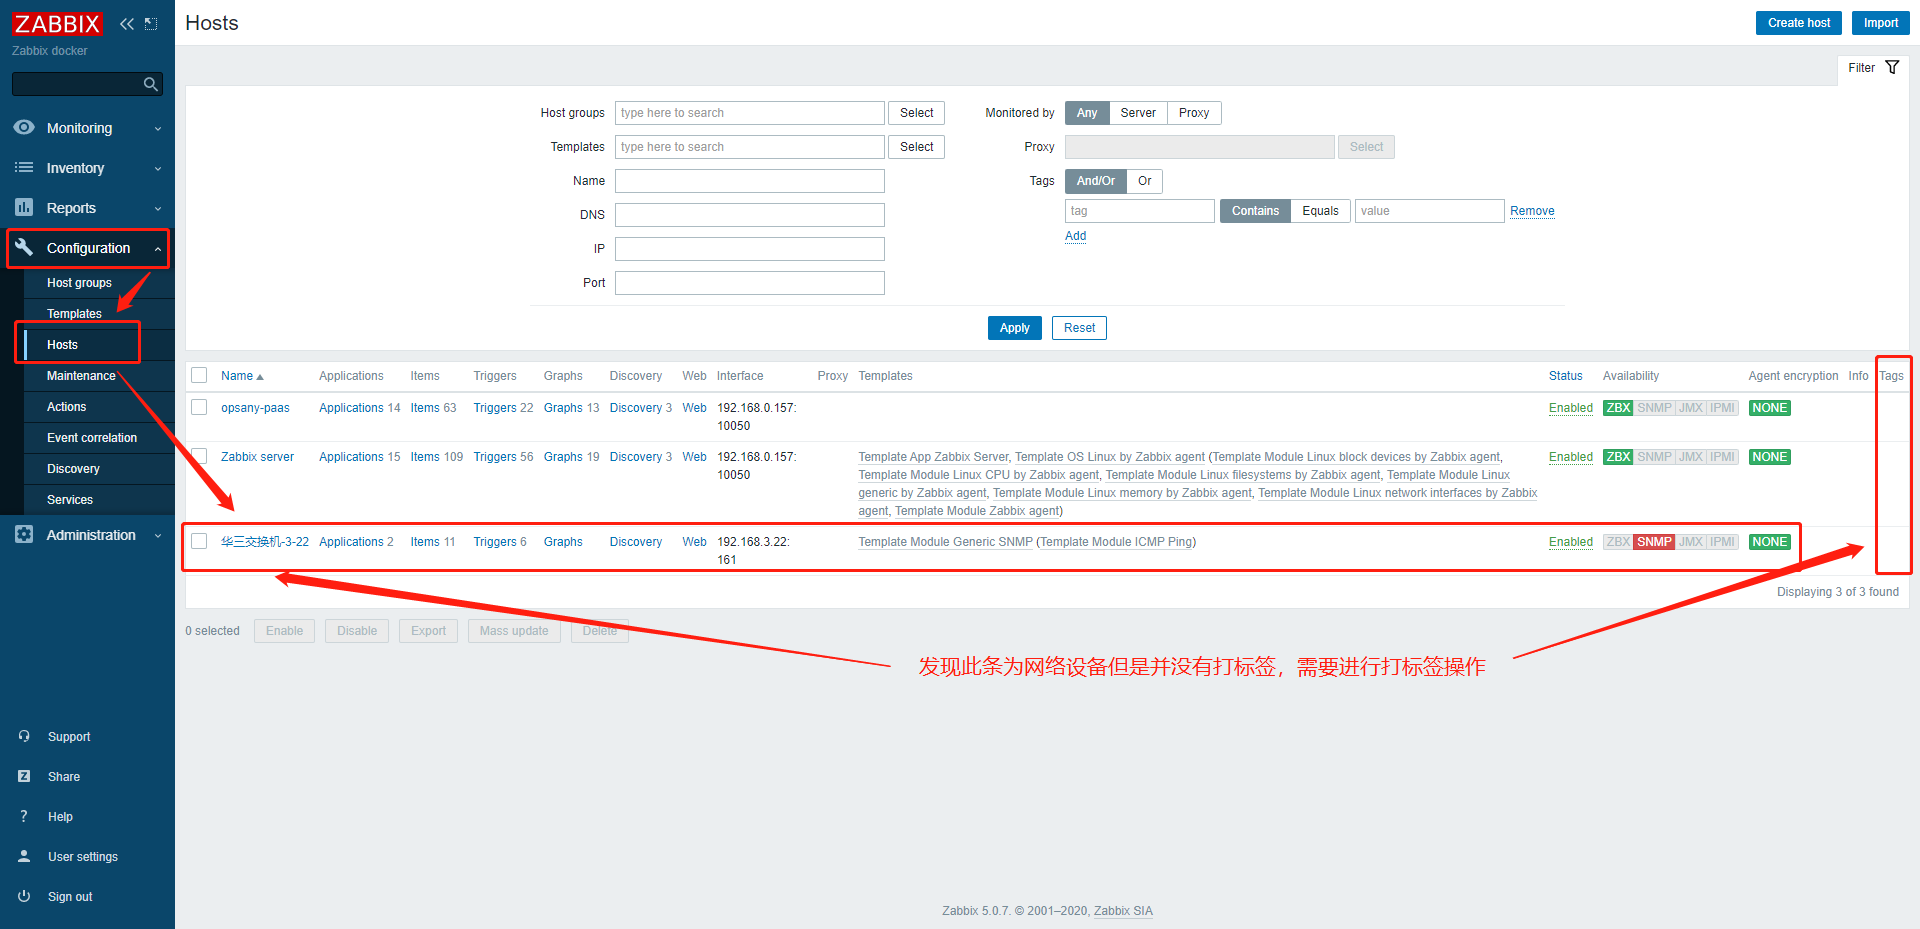
To add network devices to the Control Platform, you must first tag the network devices in Zabbix.
- Find the network device to synchronize and click to open it
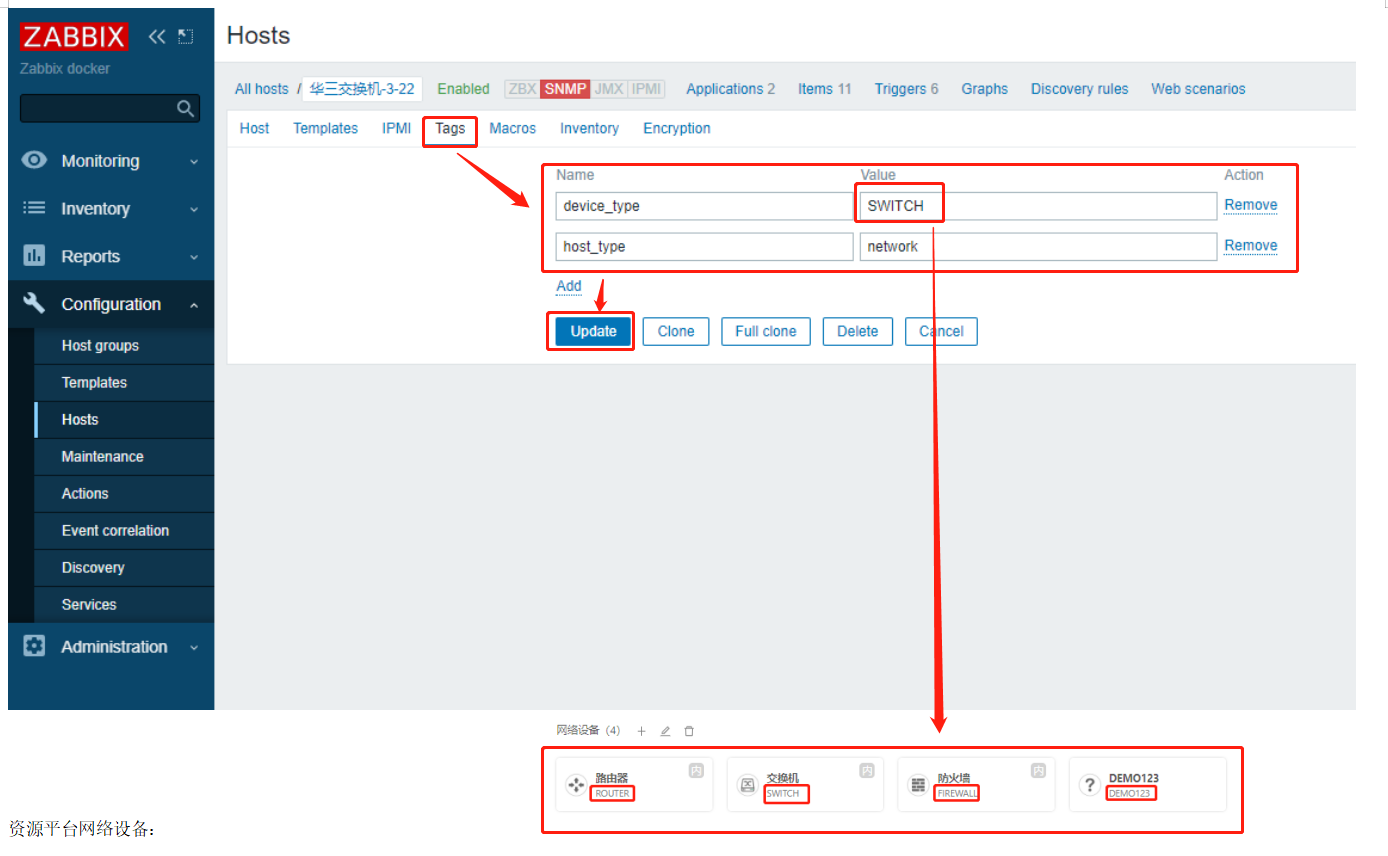
- Add the tags host_type:network and device_type:SWITCH
The device_type data comes from the unique identifier of the network device model in the Resource Platform (the device type is determined by device_type during synchronization).
- Check whether the tags were applied successfully
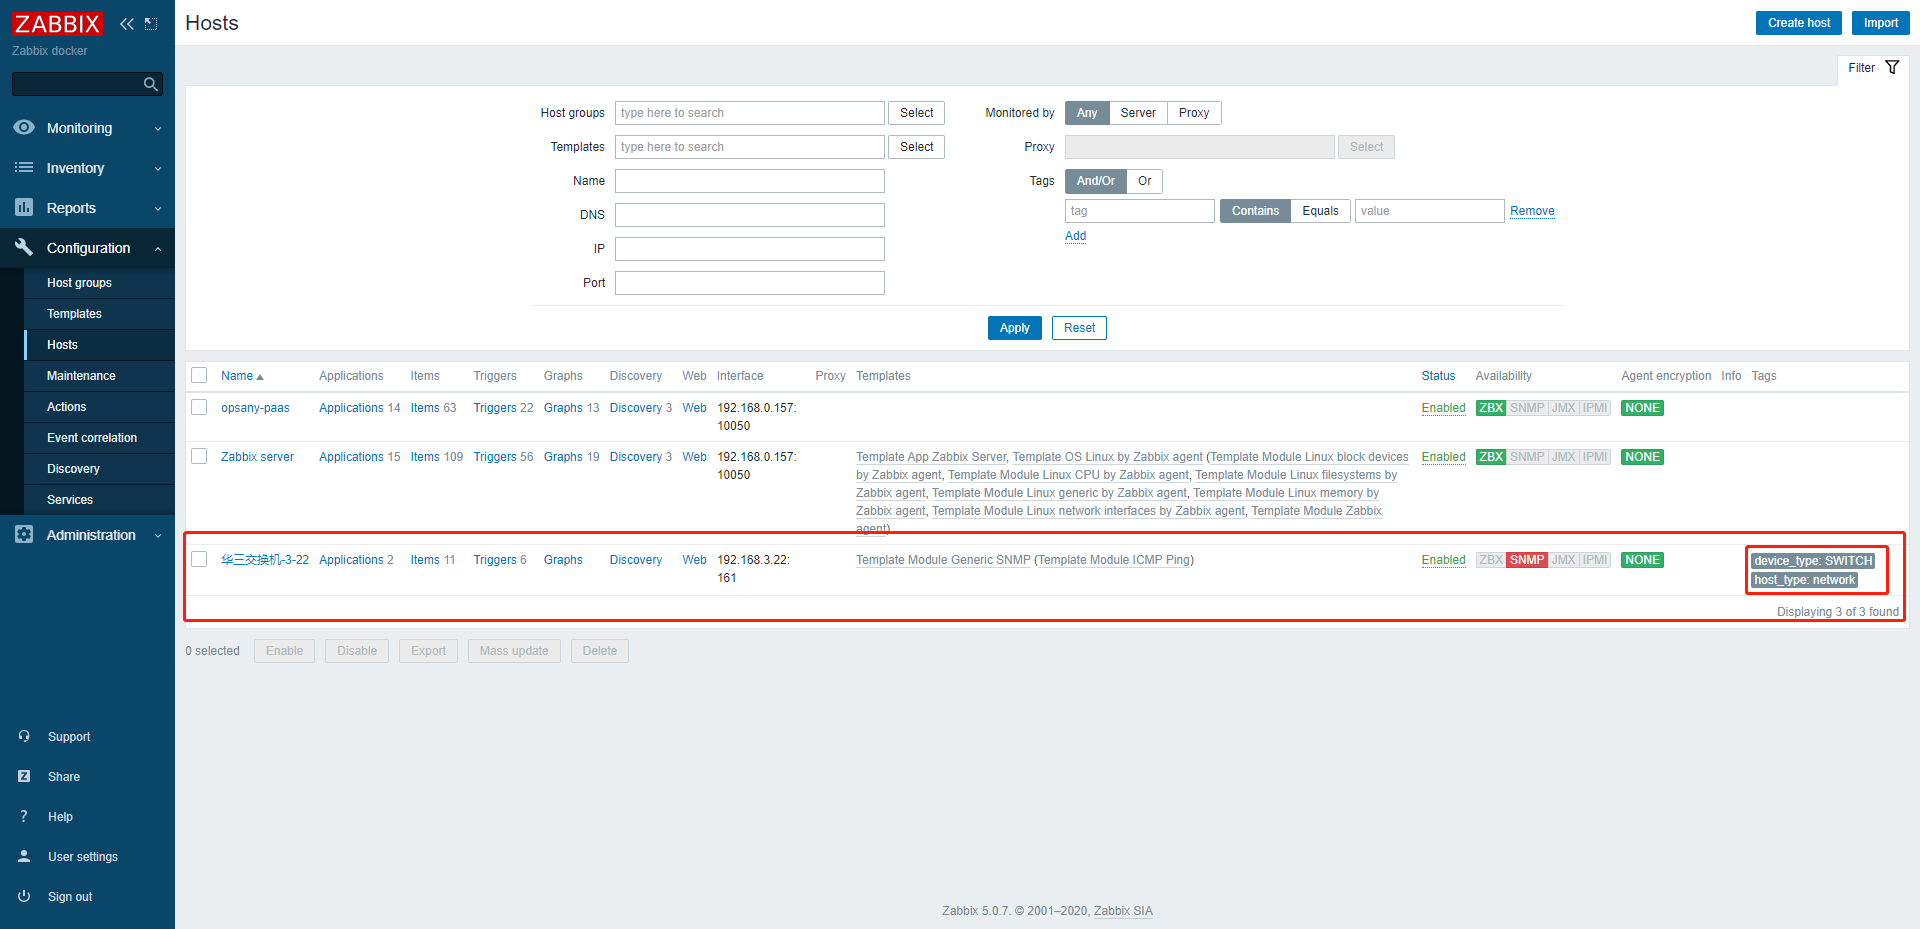 Note: If a network device does not have the specified tags, it is synchronized to Host Management as host data.
After these steps, you can run the synchronization.
5.1.4 Prometheus Integration
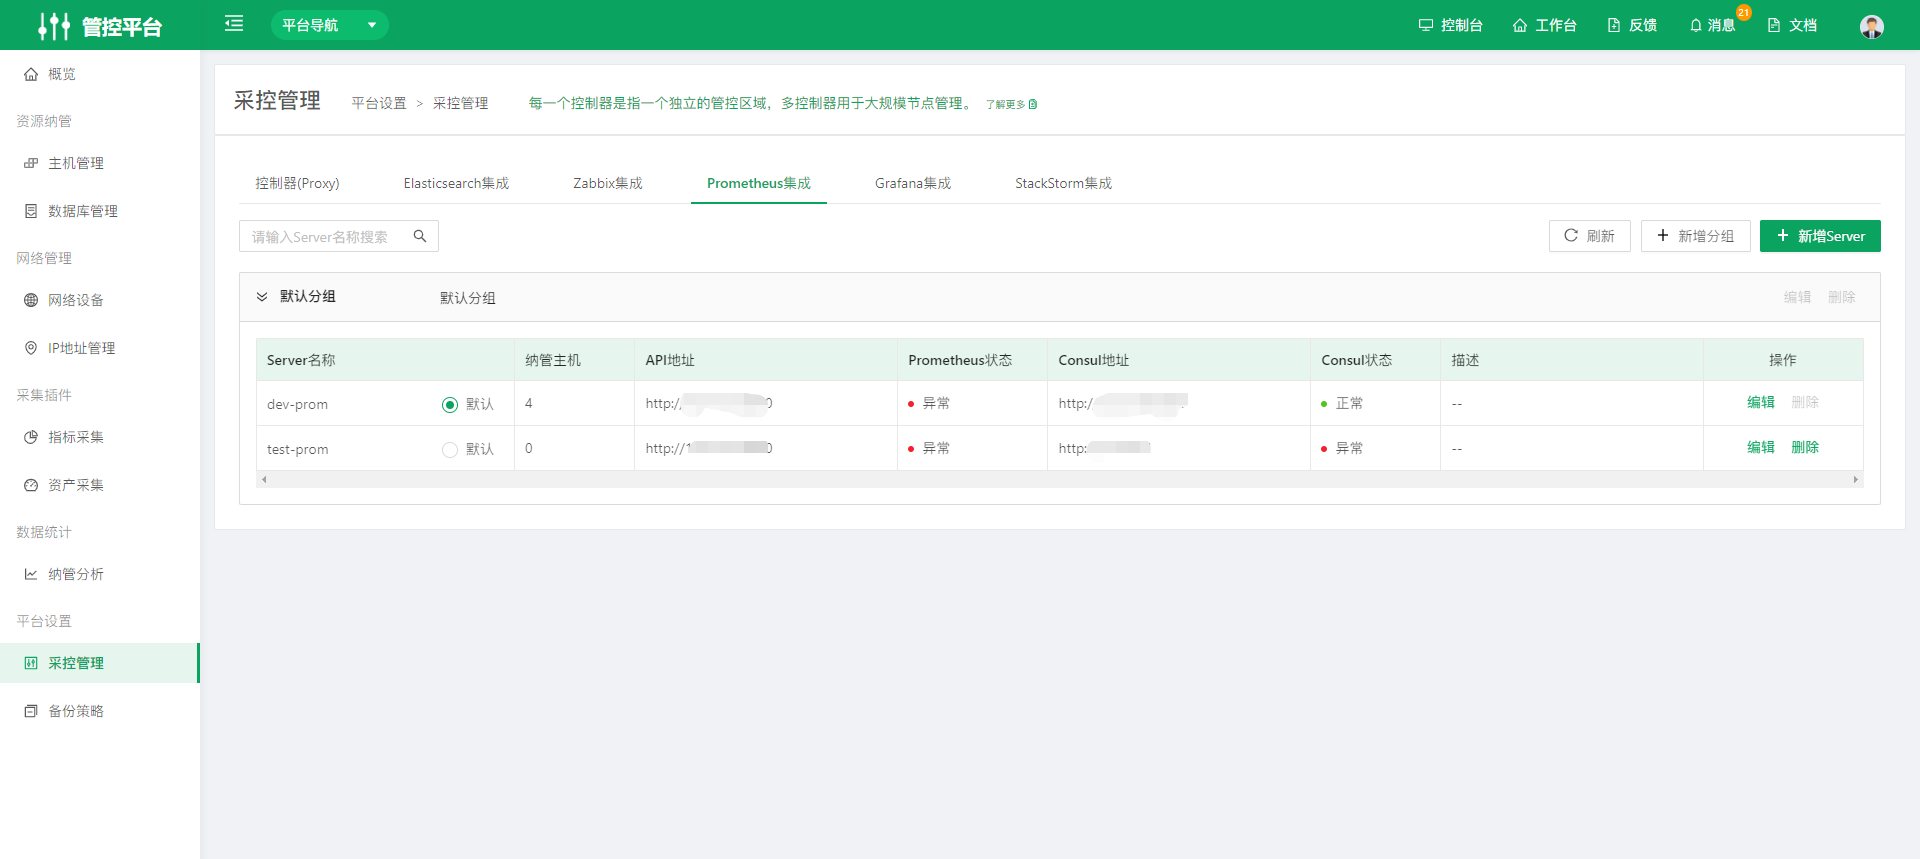
Create a Prometheus Server
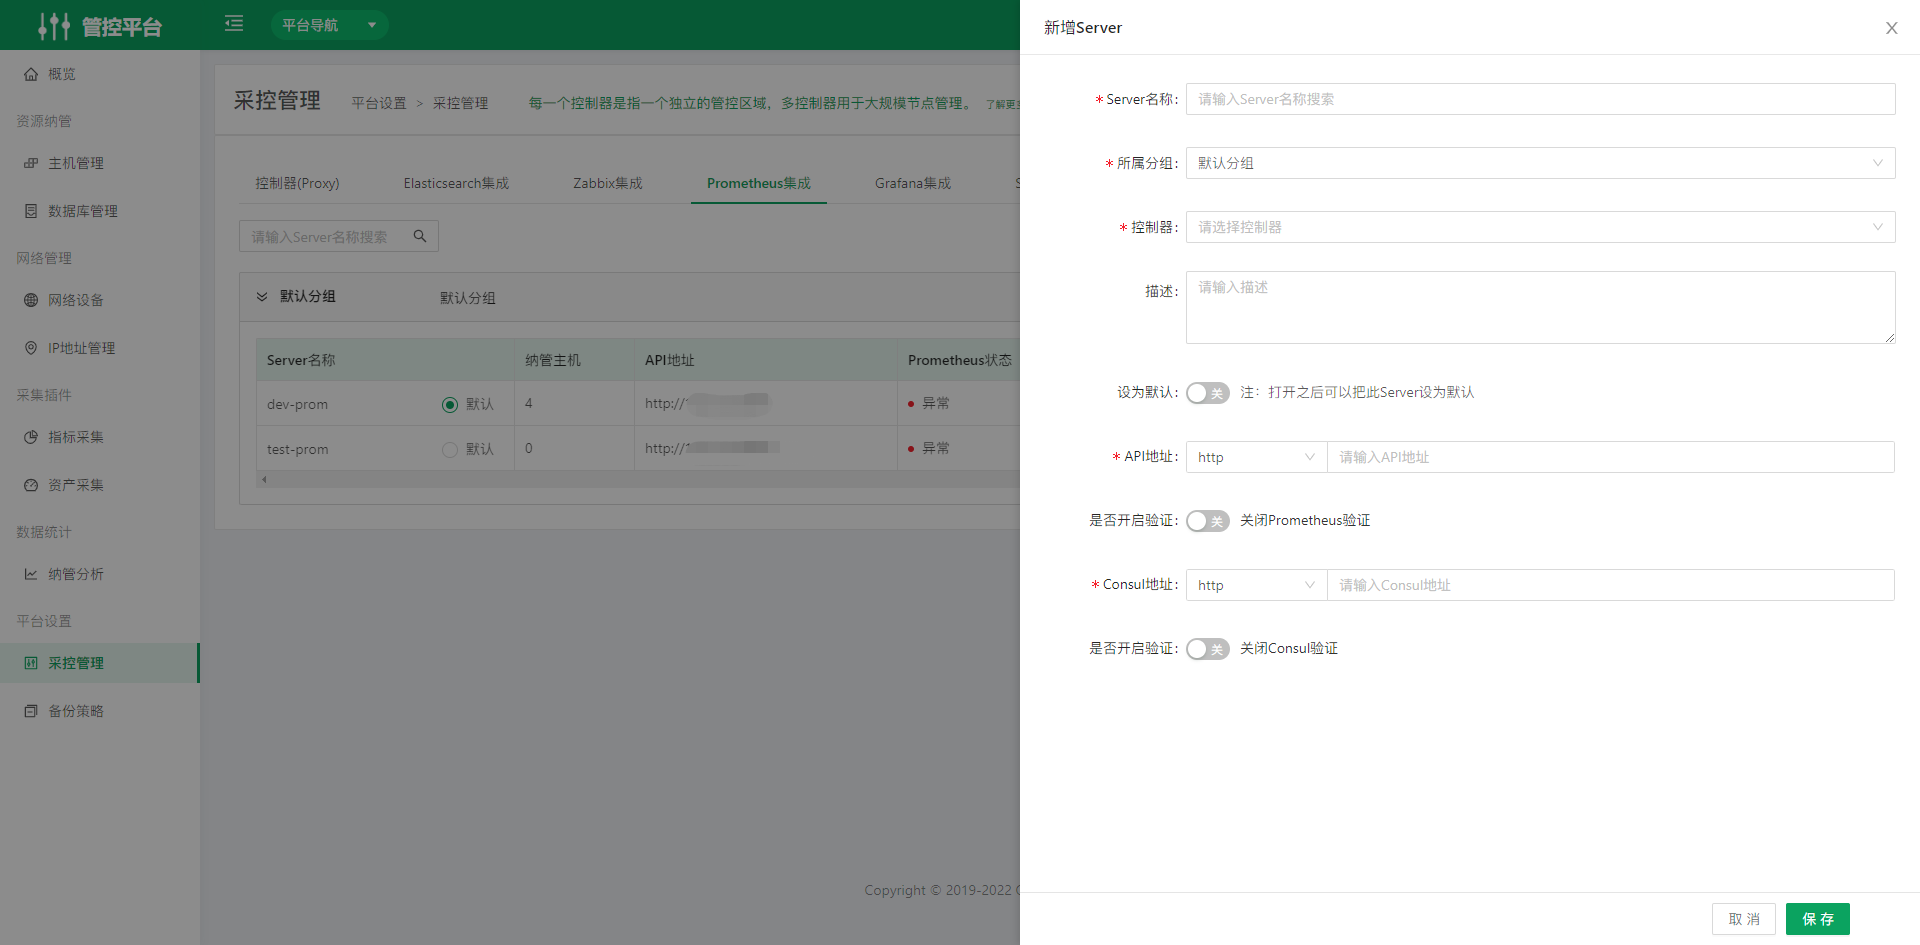 Complete the fields on the page to create the server.
5.1.5 Grafana Integration
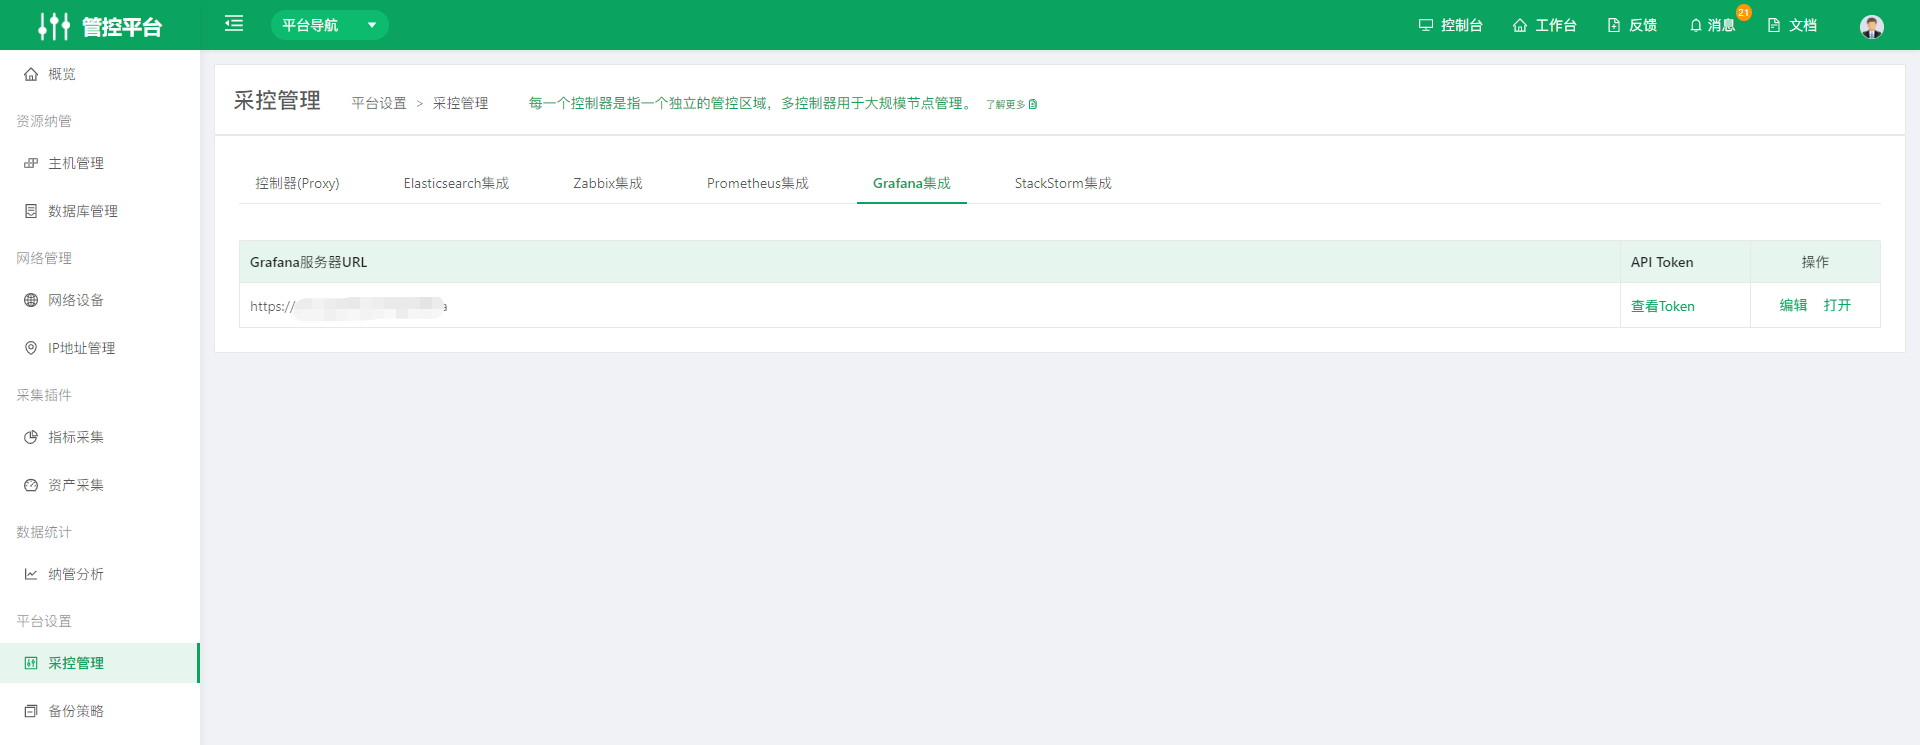
Grafana is integrated by default and used by the Monitor Platform.
5.1.6 StackStorm Integration
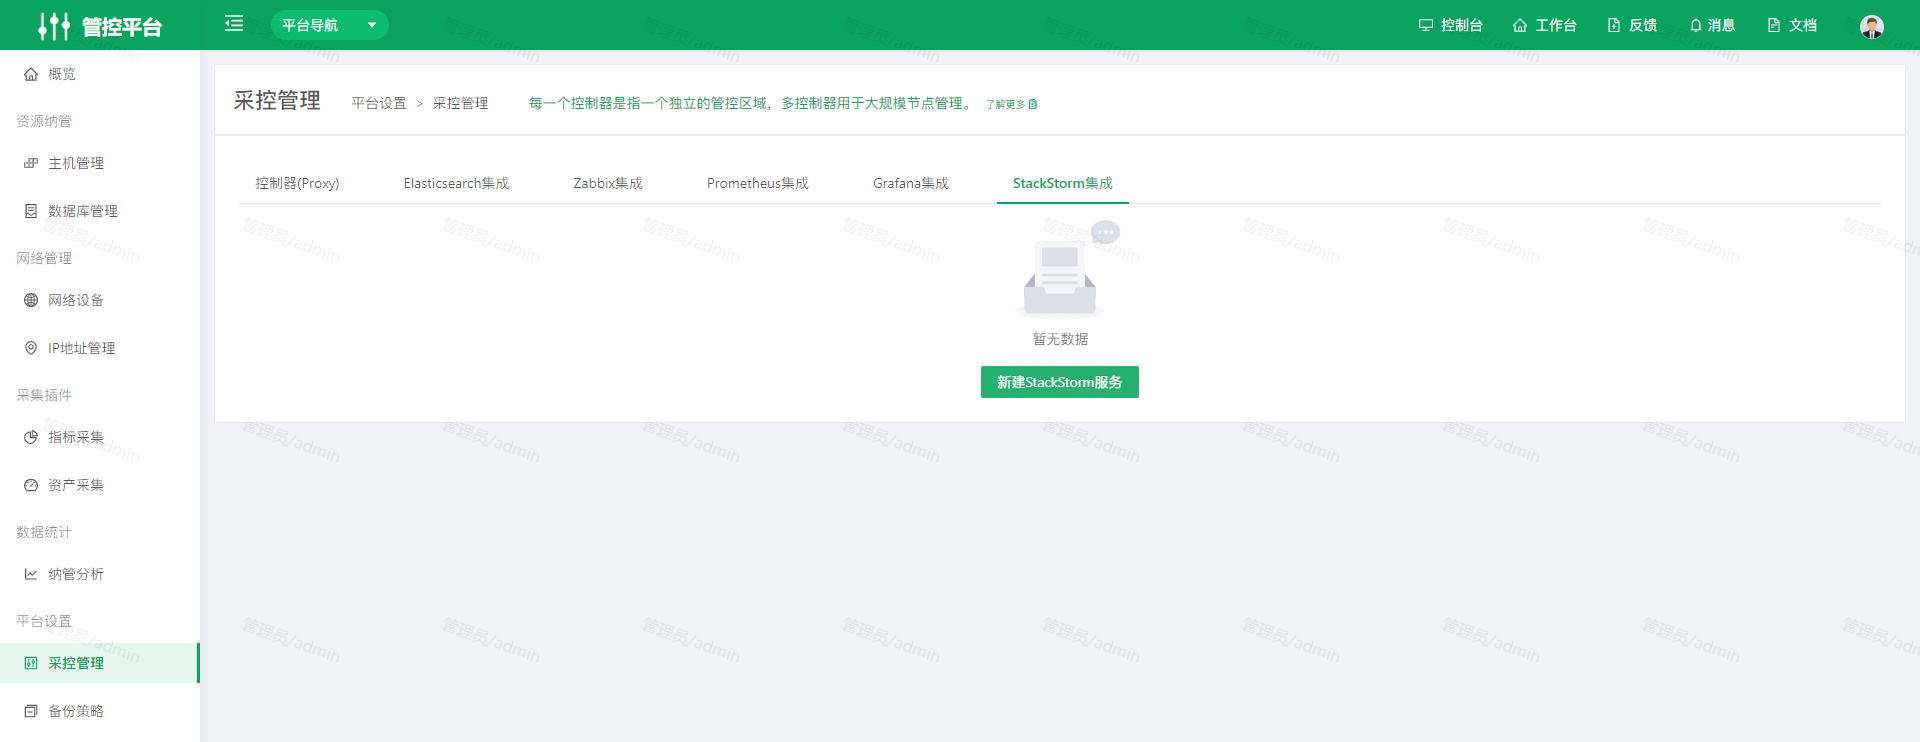
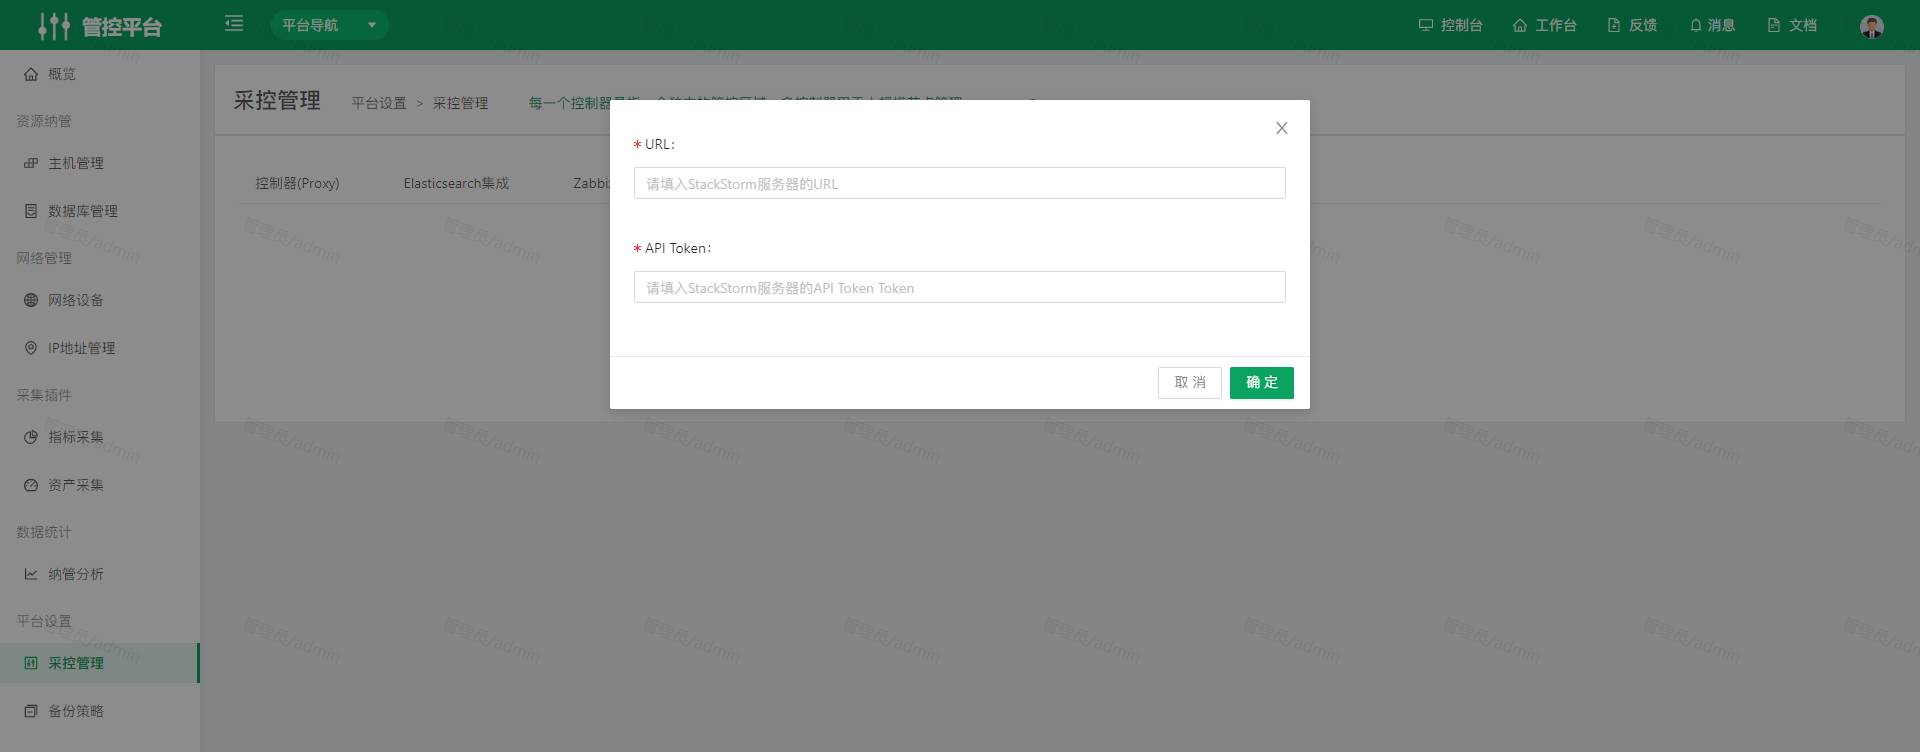
Click Create StackStorm Service to create one. Enter the URL and API Token of the StackStorm server; only one can be added. The StackStorm service is used for event operations in the Stability Platform.
5.2 Backup Policies
Set corresponding backup collection parameters for network devices of different vendors and models.
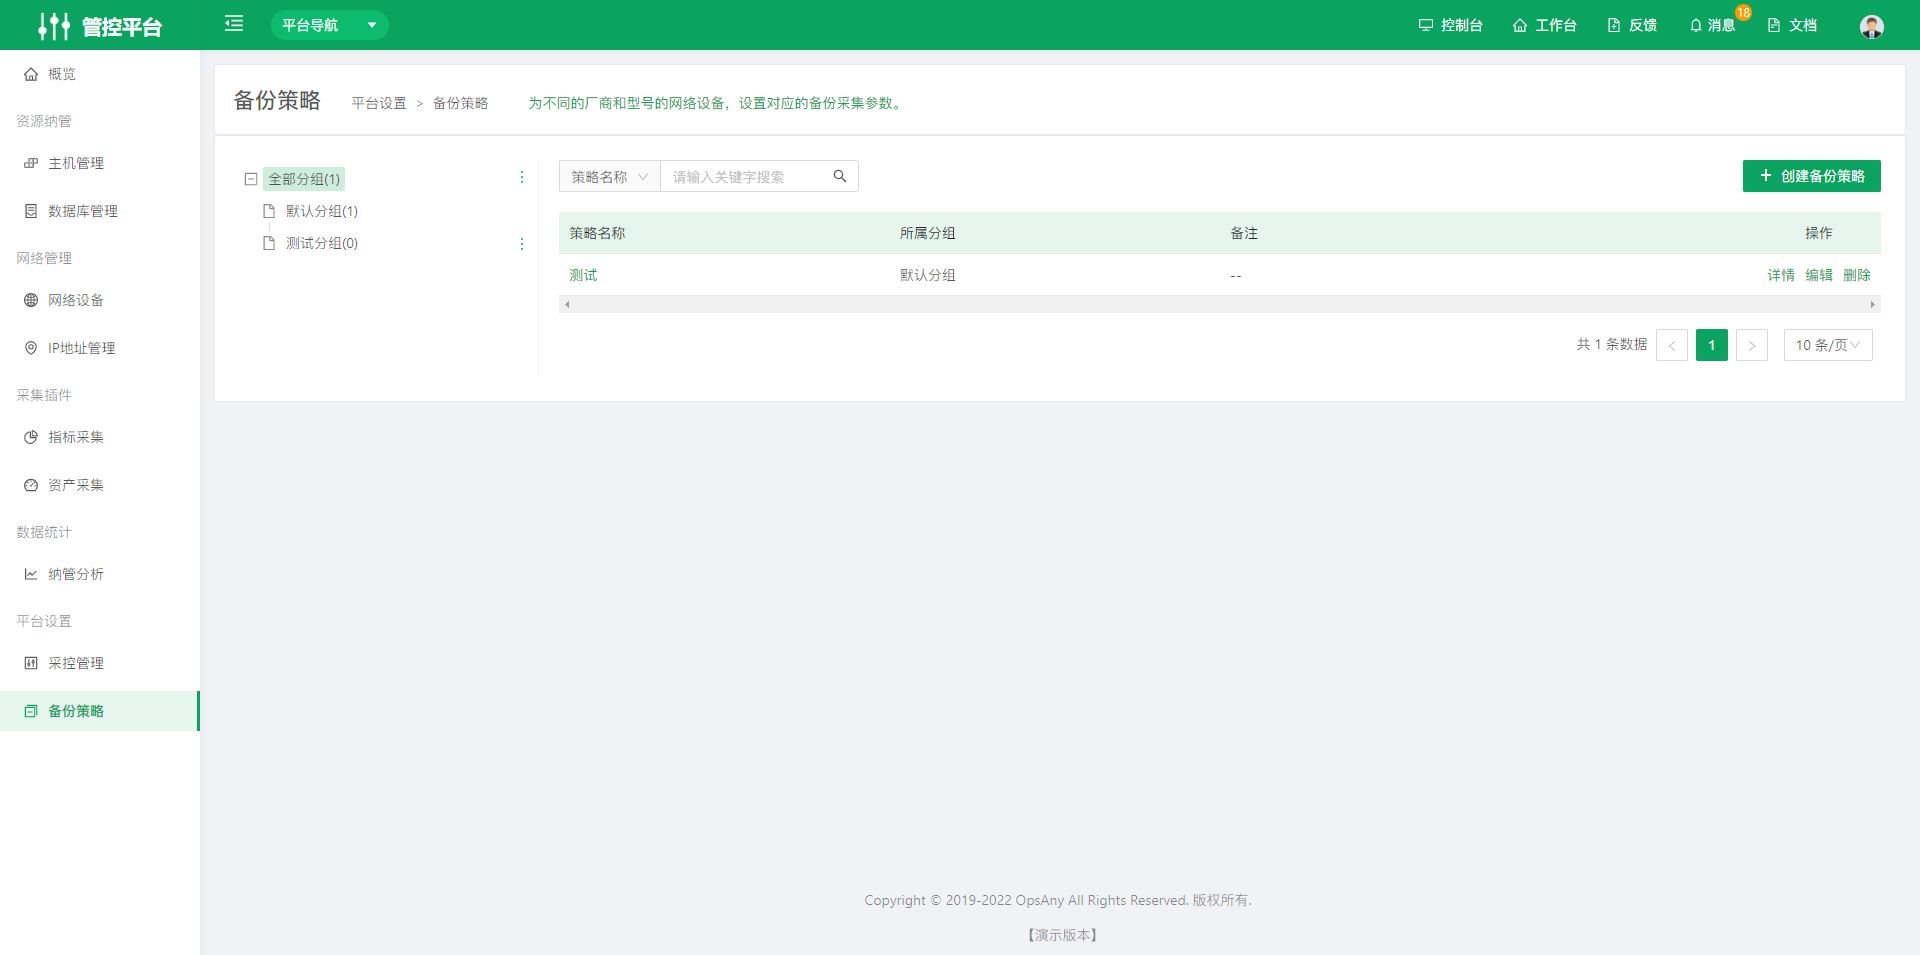
Go to the Backup Policies page and click Create Backup Policy in the upper right corner. After the page opens, complete the relevant fields to create the policy.
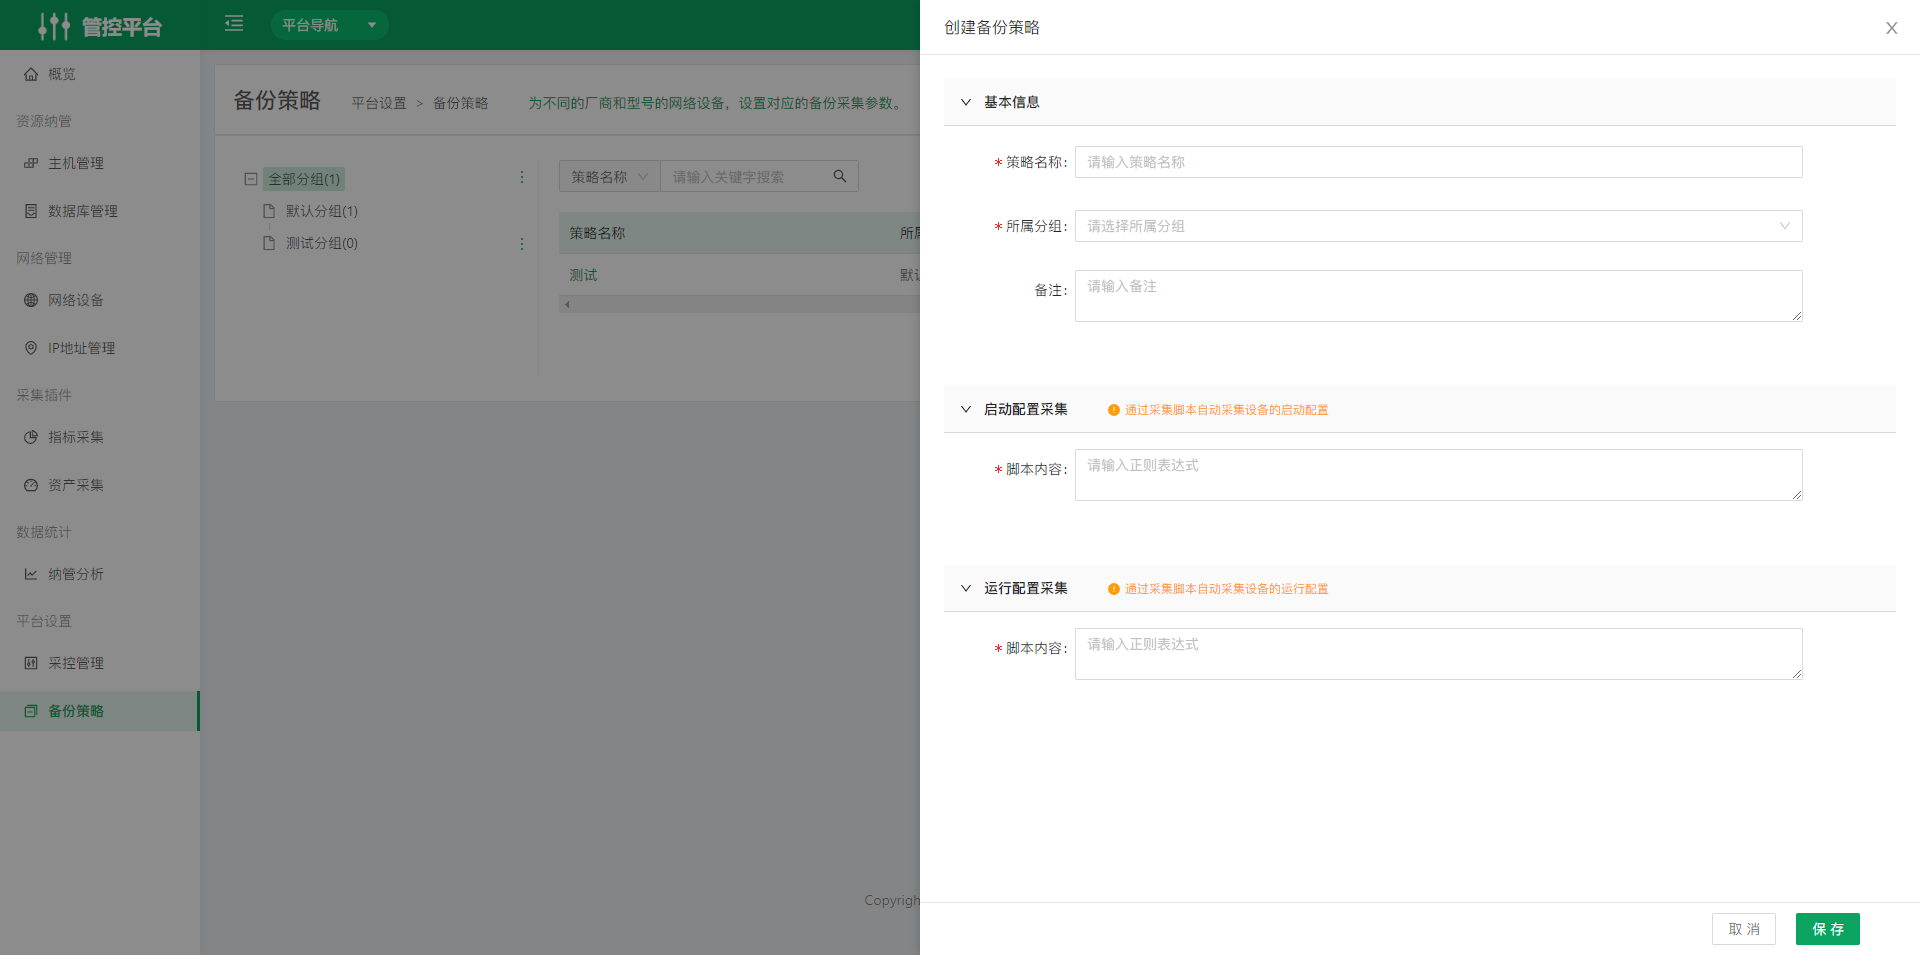
Backups work by automatically executing commands on the target device and saving the command output. So the backup script essentially contains the network device commands themselves.
Cisco switches:
View running configuration:

show running-config

View startup configuration:

show startup-config
H3C and Huawei switches:
View running configuration:

display current-configuration

View startup configuration:

display saved-configuration
Info
Open source technology statement: OpsAny actively embraces open source technology and encourages everyone to protect the intellectual property rights of open source technology and to use it lawfully. The Control Platform uses the following open source technologies.
- Ansible: https://github.com/ansible/ansible
- SaltStack: https://github.com/saltstack/salt
Note: OpsAny is the industry's earliest operations product to support both Ansible and SaltStack.