












Grafana Visualization in Practice
OpsAny basic monitoring visualizes data by embedding Grafana, a widely used open-source tool. Knowing your way around Grafana pays off in any project environment: it can visualize data from Zabbix, Prometheus, Elasticsearch, and more.
Grafana fundamentals
Grafana is an open-source visualization tool focused on monitoring and analyzing data. It supports many data sources and presents data through charts, dashboards, and other visualization components, helping users understand and analyze system performance and health. Grafana is commonly used to monitor applications, infrastructure, and business metrics, and is widely applied in DevOps, IT operations, and business analytics.
Grafana data sources
A data source is the backend service or database Grafana uses to fetch and query data. Grafana supports many data source types, so you can pick the right one for your visualization. Common data sources include: - 1. Prometheus: an open-source monitoring system and time-series database, widely used to monitor microservices and containerized applications. - 2. InfluxDB: a high-performance time-series database for storing and querying time-series data. - 3. Elasticsearch: a distributed search and analytics engine, often used to store and analyze logs and events. - 4. MySQL/PostgreSQL: relational databases Grafana can query with SQL. - 5. Graphite: an open-source monitoring tool focused on storing and visualizing time-series data.
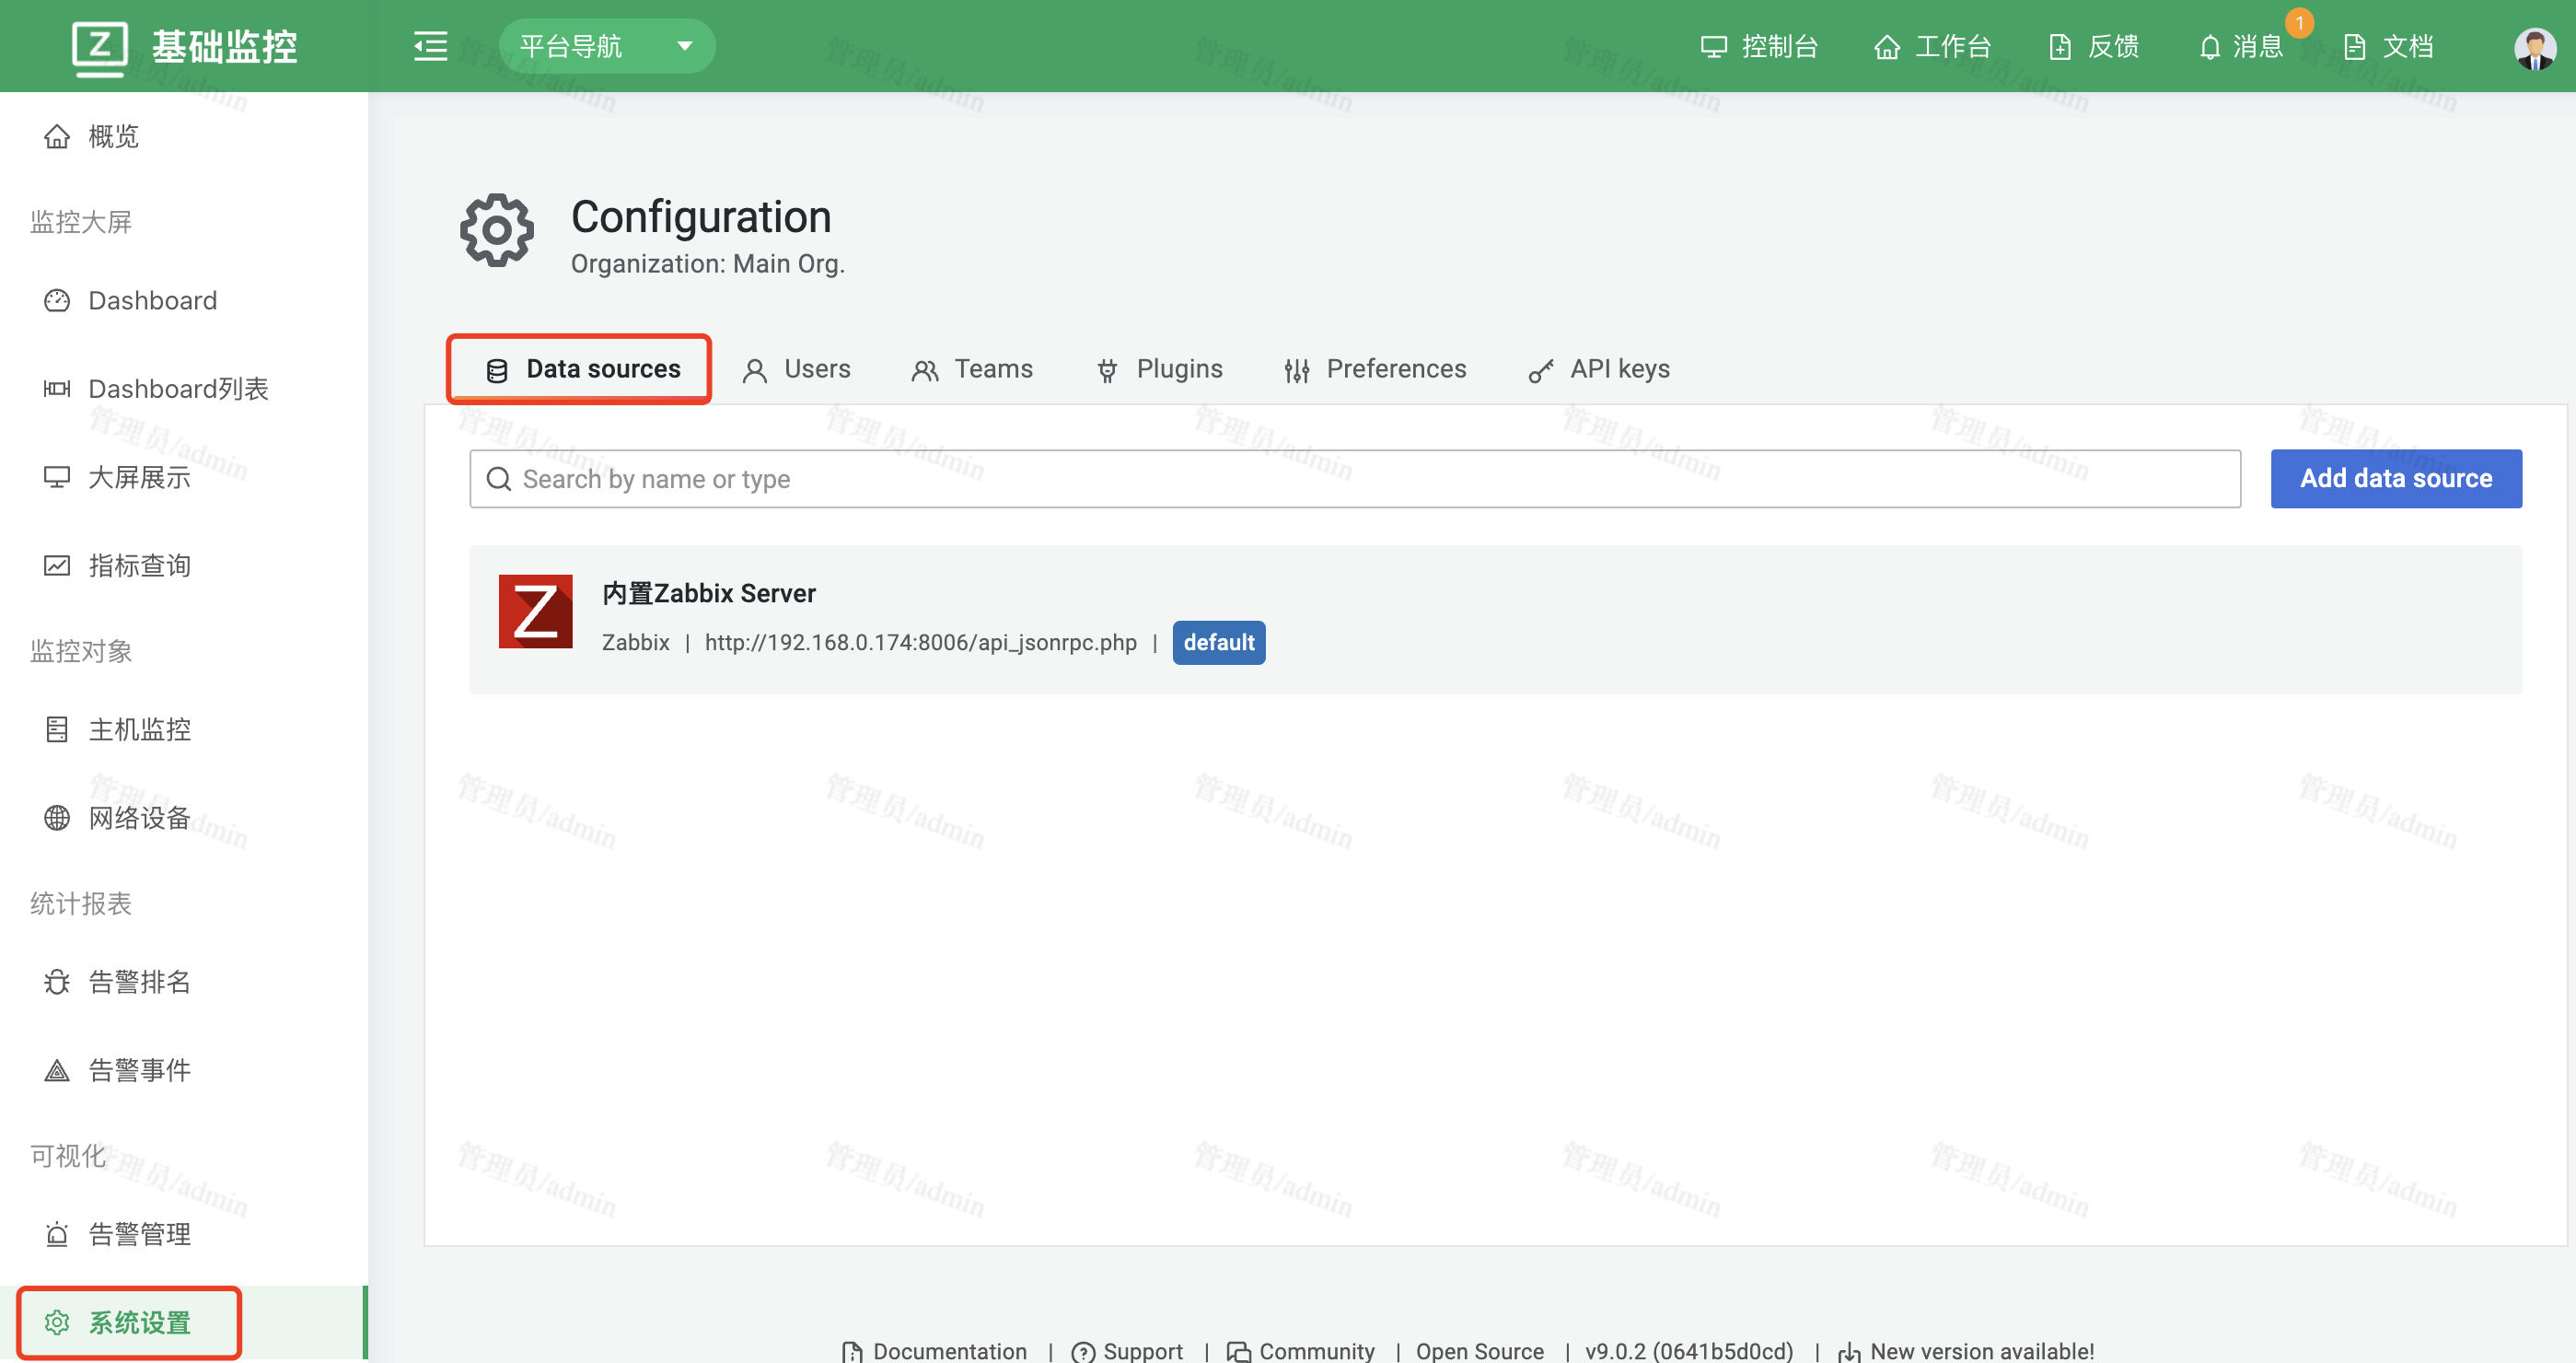
For convenience, basic monitoring embeds Grafana's settings pages directly, so you can configure data sources in Grafana — connection parameters and query methods — to fetch the data you want to visualize. If the built-in data sources are not enough — for example, Grafana has no built-in Zabbix data source — plugins can add support.
Grafana plugins
Grafana plugins extend its functionality: installing them adds new data sources, visualization components, or applications. They fall into these categories: - 1. Data source plugins: let Grafana connect to new data sources — for example, fetching data from a particular database or service. - 2. Panel plugins: provide new visualization components for dashboards — for example, presenting data in a different chart form. - 3. App plugins: bundle panels and data sources into a specific capability or solution — for example, an app plugin focused on monitoring Kubernetes cluster performance.
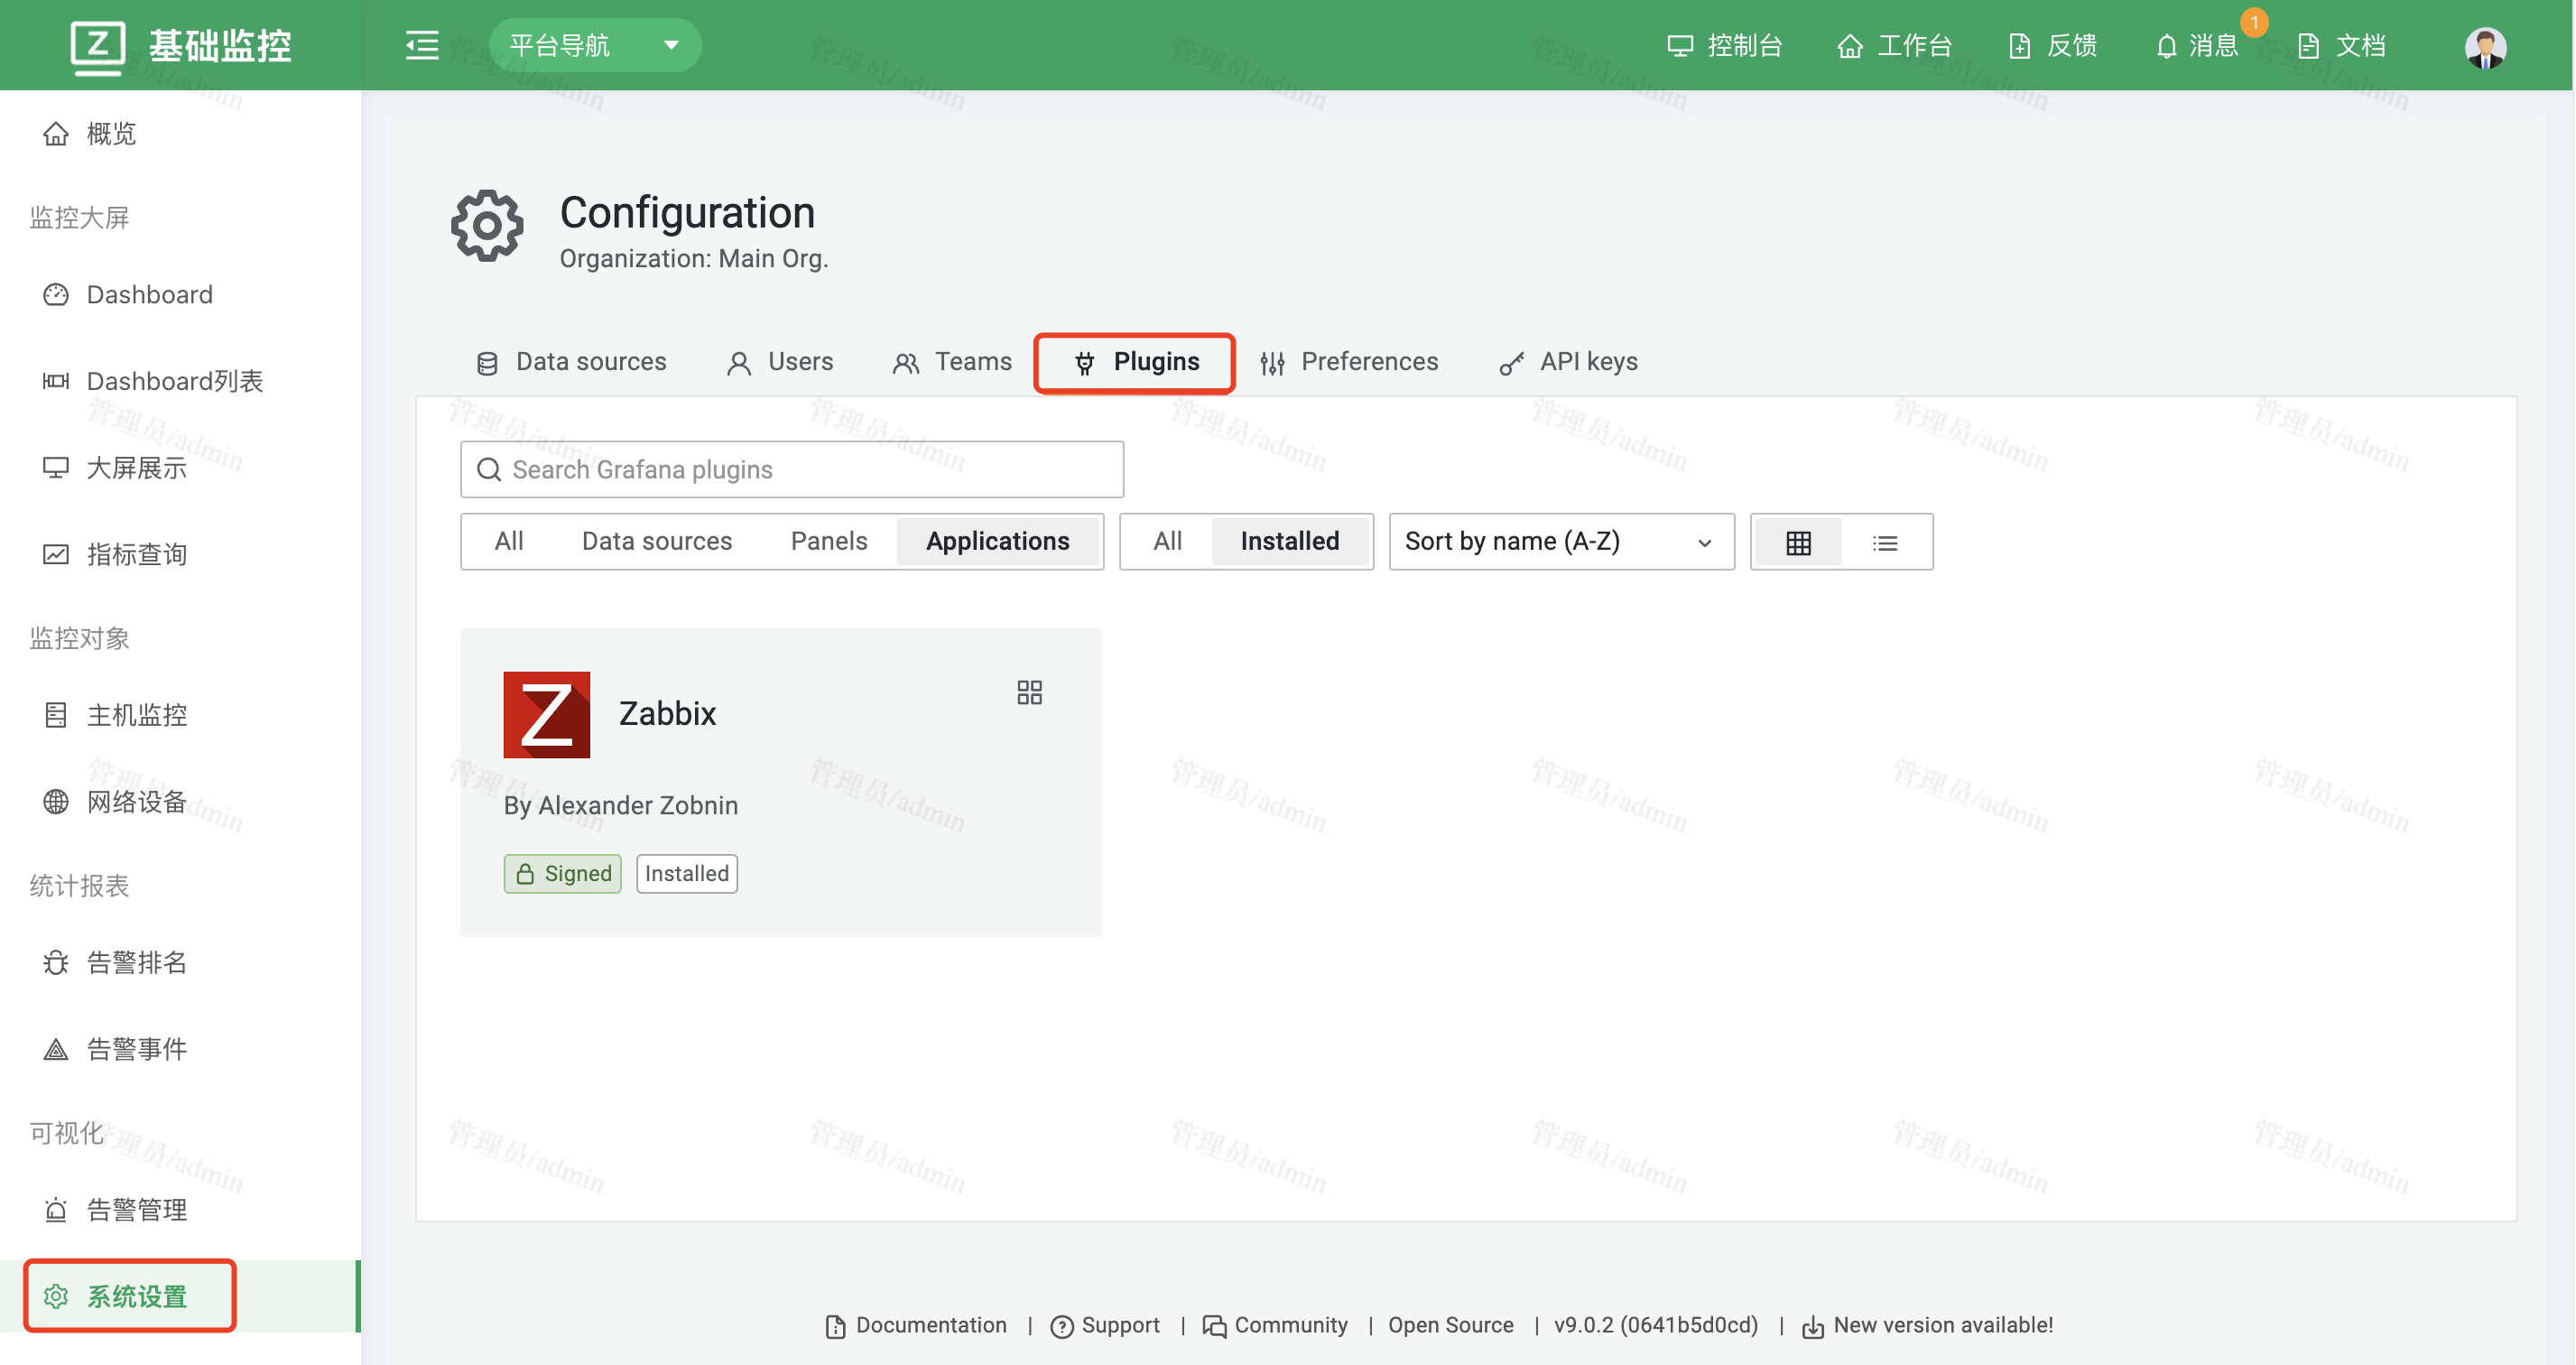
Plugins are easy to install and manage from Grafana's plugin management UI, and the rich community plugin library lets you pick what you need. OpsAny's deployment scripts automatically install the Zabbix plugin for Grafana and restart opsany-base-grafana to apply it.
Grafana dashboards
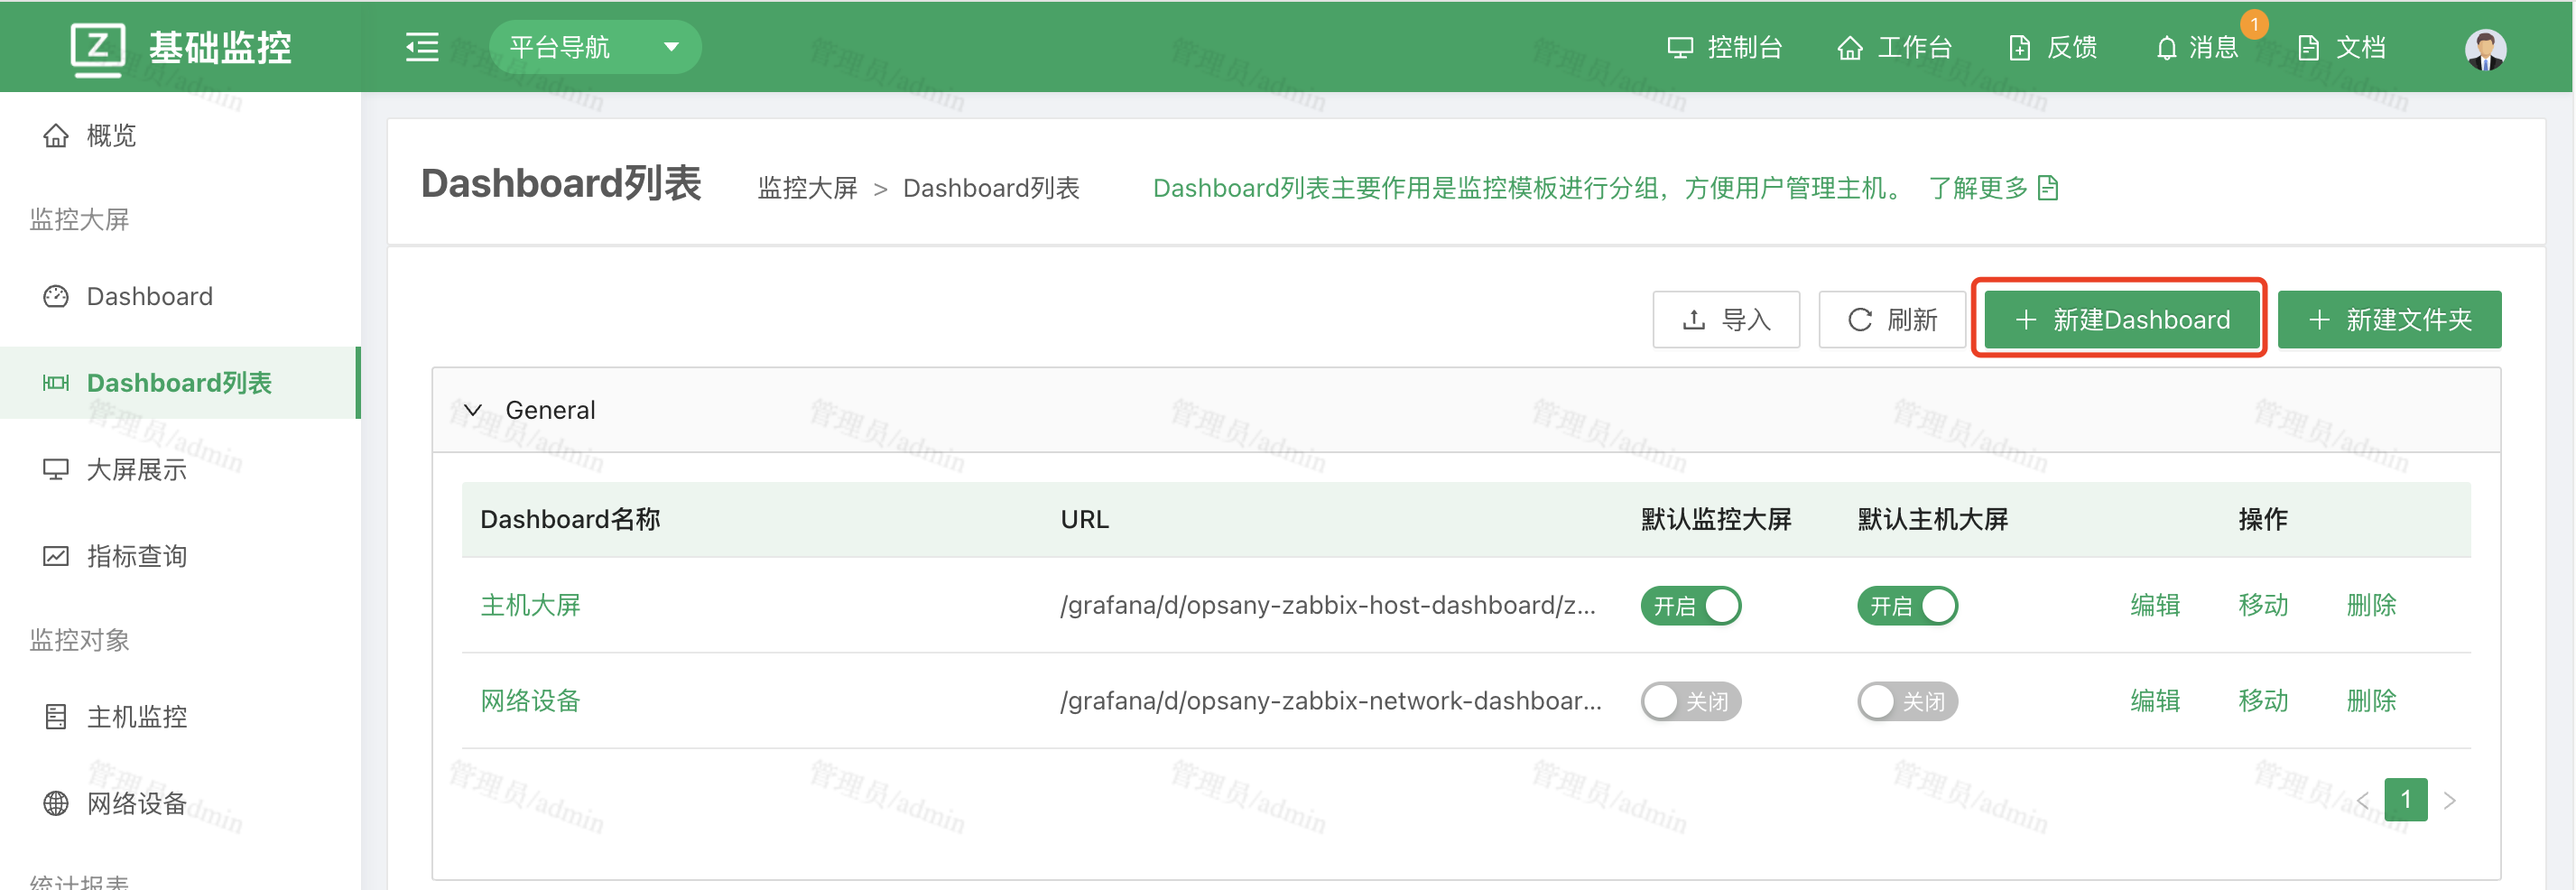
Once data sources or plugins are configured, you can create Grafana dashboards to present data. Dashboards can be imported and exported, so you can start from a third-party dashboard and modify it rather than facing a blank canvas.
You can create a new Dashboard or modify a built-in one — your choice. Grafana publishes many dashboards at the link below; make sure you pick the right data source:
- Grafana Dashboard: https://grafana.com/grafana/dashboards/
Dashboard variables
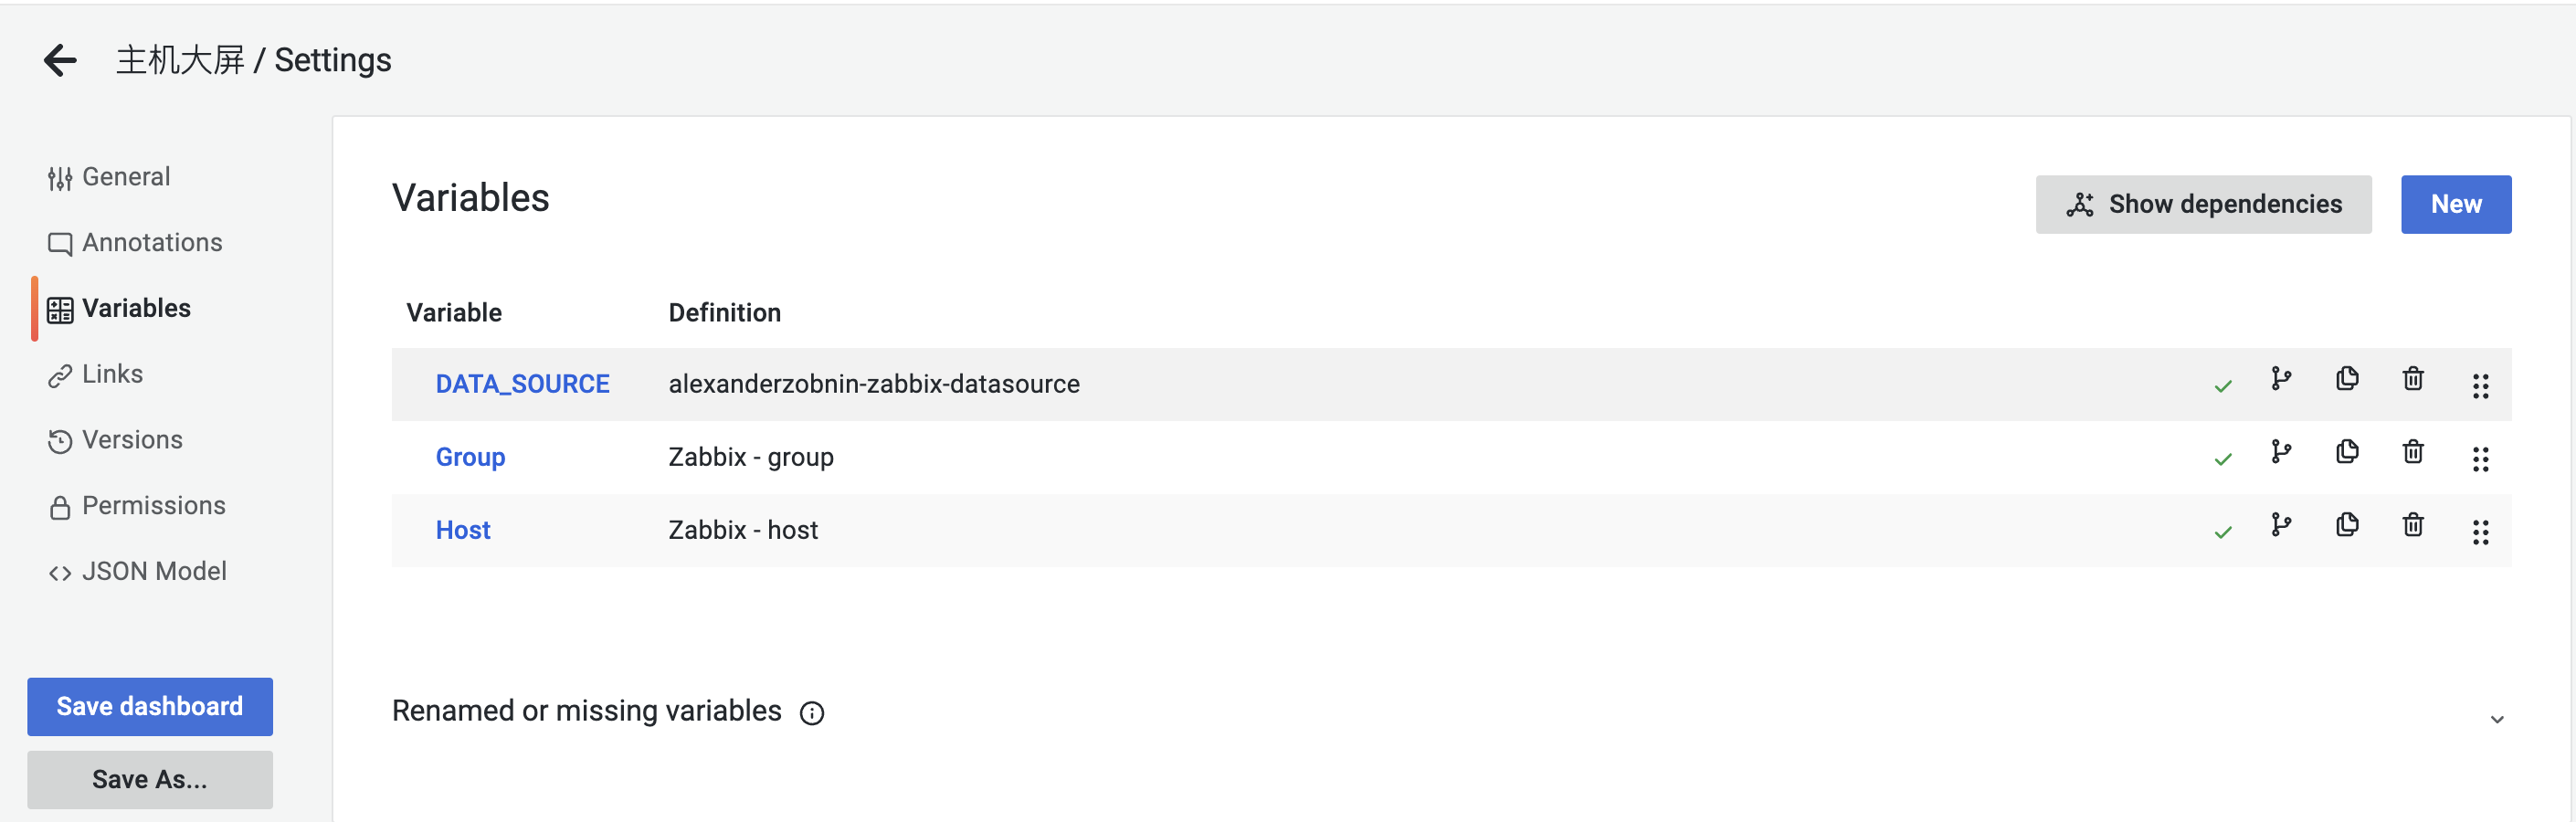
Click Settings in the top-right corner to configure the dashboard. The first thing to understand is variables, which filter dashboard data. For example, the built-in dashboard has two variables: host group and host.
Dashboard panels
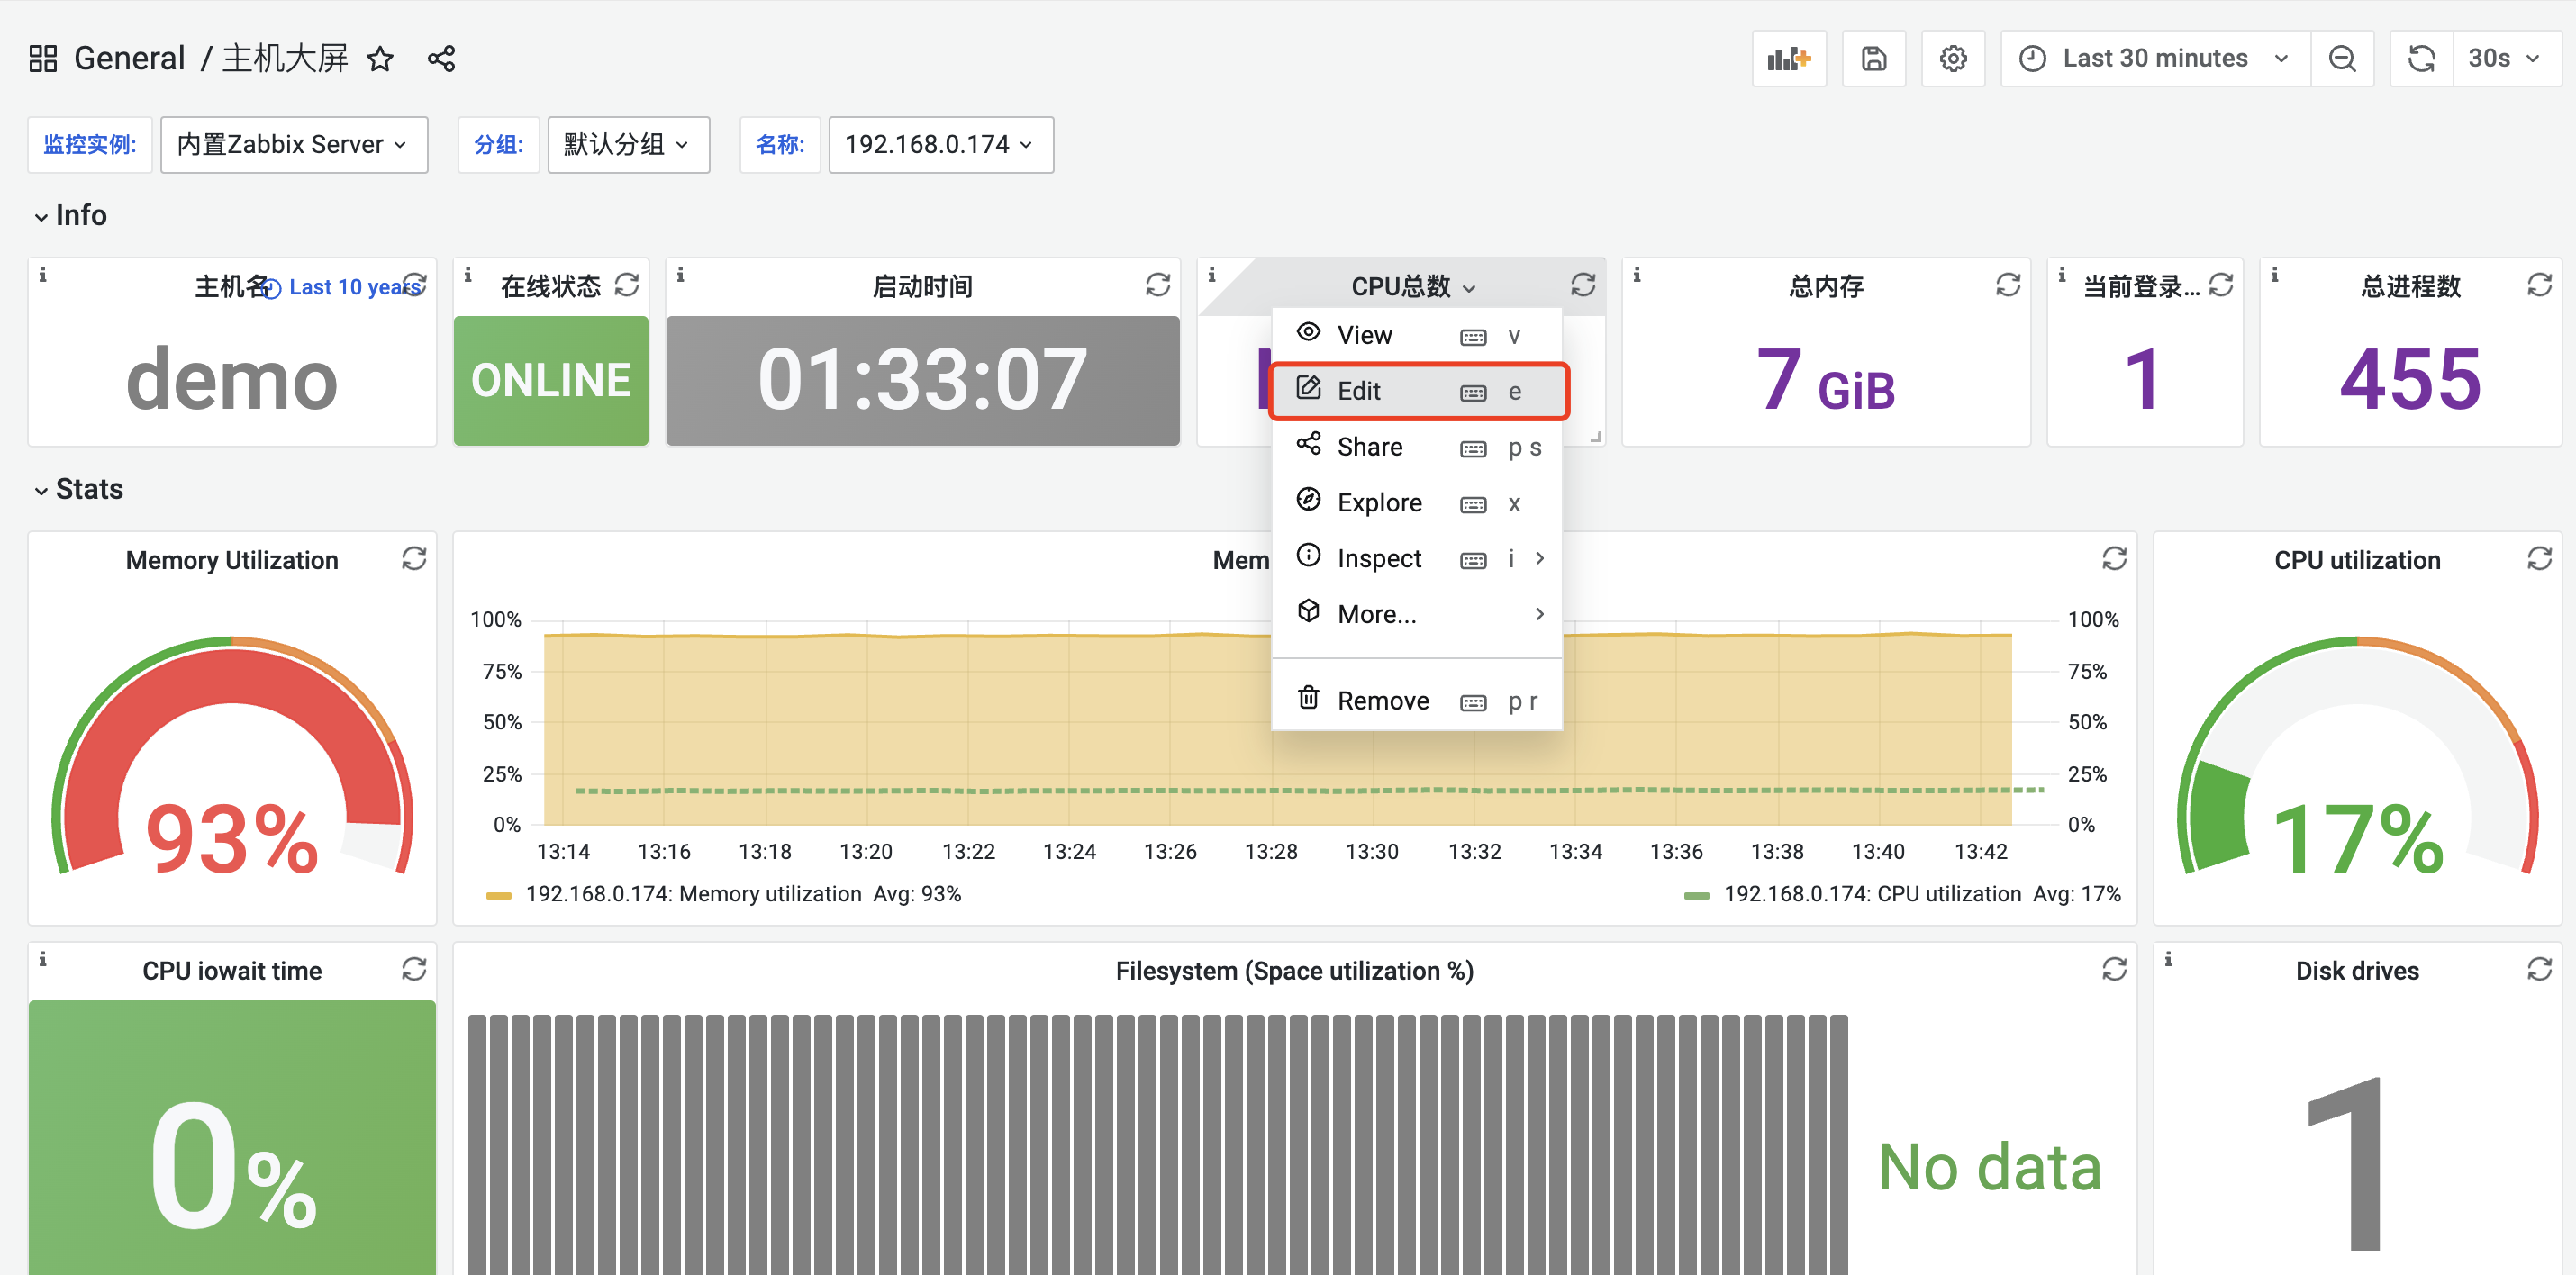
You can edit Grafana's charts directly; in Grafana they are called Panels. To group several Panels you can use Rows. The example below edits a Panel showing total CPU: