













Basic Monitoring Integration
Deploying Basic Monitoring (optional)
OpsAny Community Edition monitoring requires Zabbix. You can connect an existing Zabbix deployment to OpsAny. If you have never used Zabbix, skip the monitoring platform.
1. Deploy basic monitoring
Basic monitoring is installed by default. Check the platform navigation for a Monitoring entry.
- Set the admin password
Before installing, check whether you have changed the admin password. By default the script reads it from $INSTALL_PATH/conf/.passwd_env; if you changed the password, update that file.
INSTALL_PATH=/opt/opsany
vim $INSTALL_PATH/conf/.passwd_env
- Install the monitoring platform
OpsAny installs basic monitoring by default since v2.2.0 — do not install it twice.
cd /opt/opsany-paas/install/
./saas-ce-install.sh monitor
2. Install the Zabbix plugin for Grafana
Basic monitoring is installed by default. Check the platform navigation for a Monitoring entry.
All monitoring dashboards in OpsAny are rendered by Grafana, so the Grafana plugin is required to fetch data from Zabbix. Because GitHub is slow to reach from mainland China, installing the plugin with the Grafana CLI often fails. You can copy the plugin into Grafana's plugin directory manually.
cd /opt && wget https://opsany.oss-cn-beijing.aliyuncs.com/alexanderzobnin-zabbix-app-4.3.1.zip
unzip alexanderzobnin-zabbix-app-4.3.1.zip
docker cp /opt/alexanderzobnin-zabbix-app opsany-base-grafana:/var/lib/grafana/plugins/
docker restart opsany-base-grafana
Integrating Zabbix
OpsAny's monitoring capability depends on Zabbix: Zabbix integration is required to use basic monitoring. You can integrate a Zabbix Server your company already runs.
Deploying Zabbix
If you do not have Zabbix yet, you can deploy it yourself — a one-click deployment script is provided.
Note that an all-in-one deployment needs at least 16 GB of memory; 8 GB is not enough once basic monitoring is added. When you hit an unknown error, check memory usage first.
Before installing, check whether you have changed the admin password. By default it is read from $INSTALL_PATH/conf/.passwd_env; if you changed it, update that file.
INSTALL_PATH=/data/opsany
vim $INSTALL_PATH/conf/.passwd_env
- Step 1: deploy Zabbix, then open
http://DOMAIN_NAME:8006. It usually takes a few minutes to become available.
cd /opt/opsany-paas/install/
./saas-ce-install.sh zabbix_install
- Step 2: integrate Zabbix. Run this only after Zabbix is reachable and shows the login page. This adds a Zabbix integration under Control Platform → Collection Management → Zabbix Integration.
cd /opt/opsany-paas/install/
./saas-ce-install.sh zabbix_add
Tip
Since v2.2.2 the script above performs the Zabbix integration in the Control Platform automatically, removing the manual steps. If automatic integration fails, integrate manually as described below. Automatic integration also updates the Zabbix and Grafana passwords according to install.config. Note: the Zabbix user is Admin — case-sensitive.
Integrating Zabbix manually
OpsAny supports only Zabbix LTS releases, such as 5.0 LTS, 6.0 LTS, and the upcoming 7.0 LTS. Non-LTS releases such as 6.2 and 6.4 are not supported.
Open the OpsAny platform, go to Control Platform → Collection Management → (Zabbix Integration), and add a new Server. Make sure the integration status is healthy.
Zabbix installed by zabbix-install.sh listens on port 8006 by default, with username Admin and password zabbix.
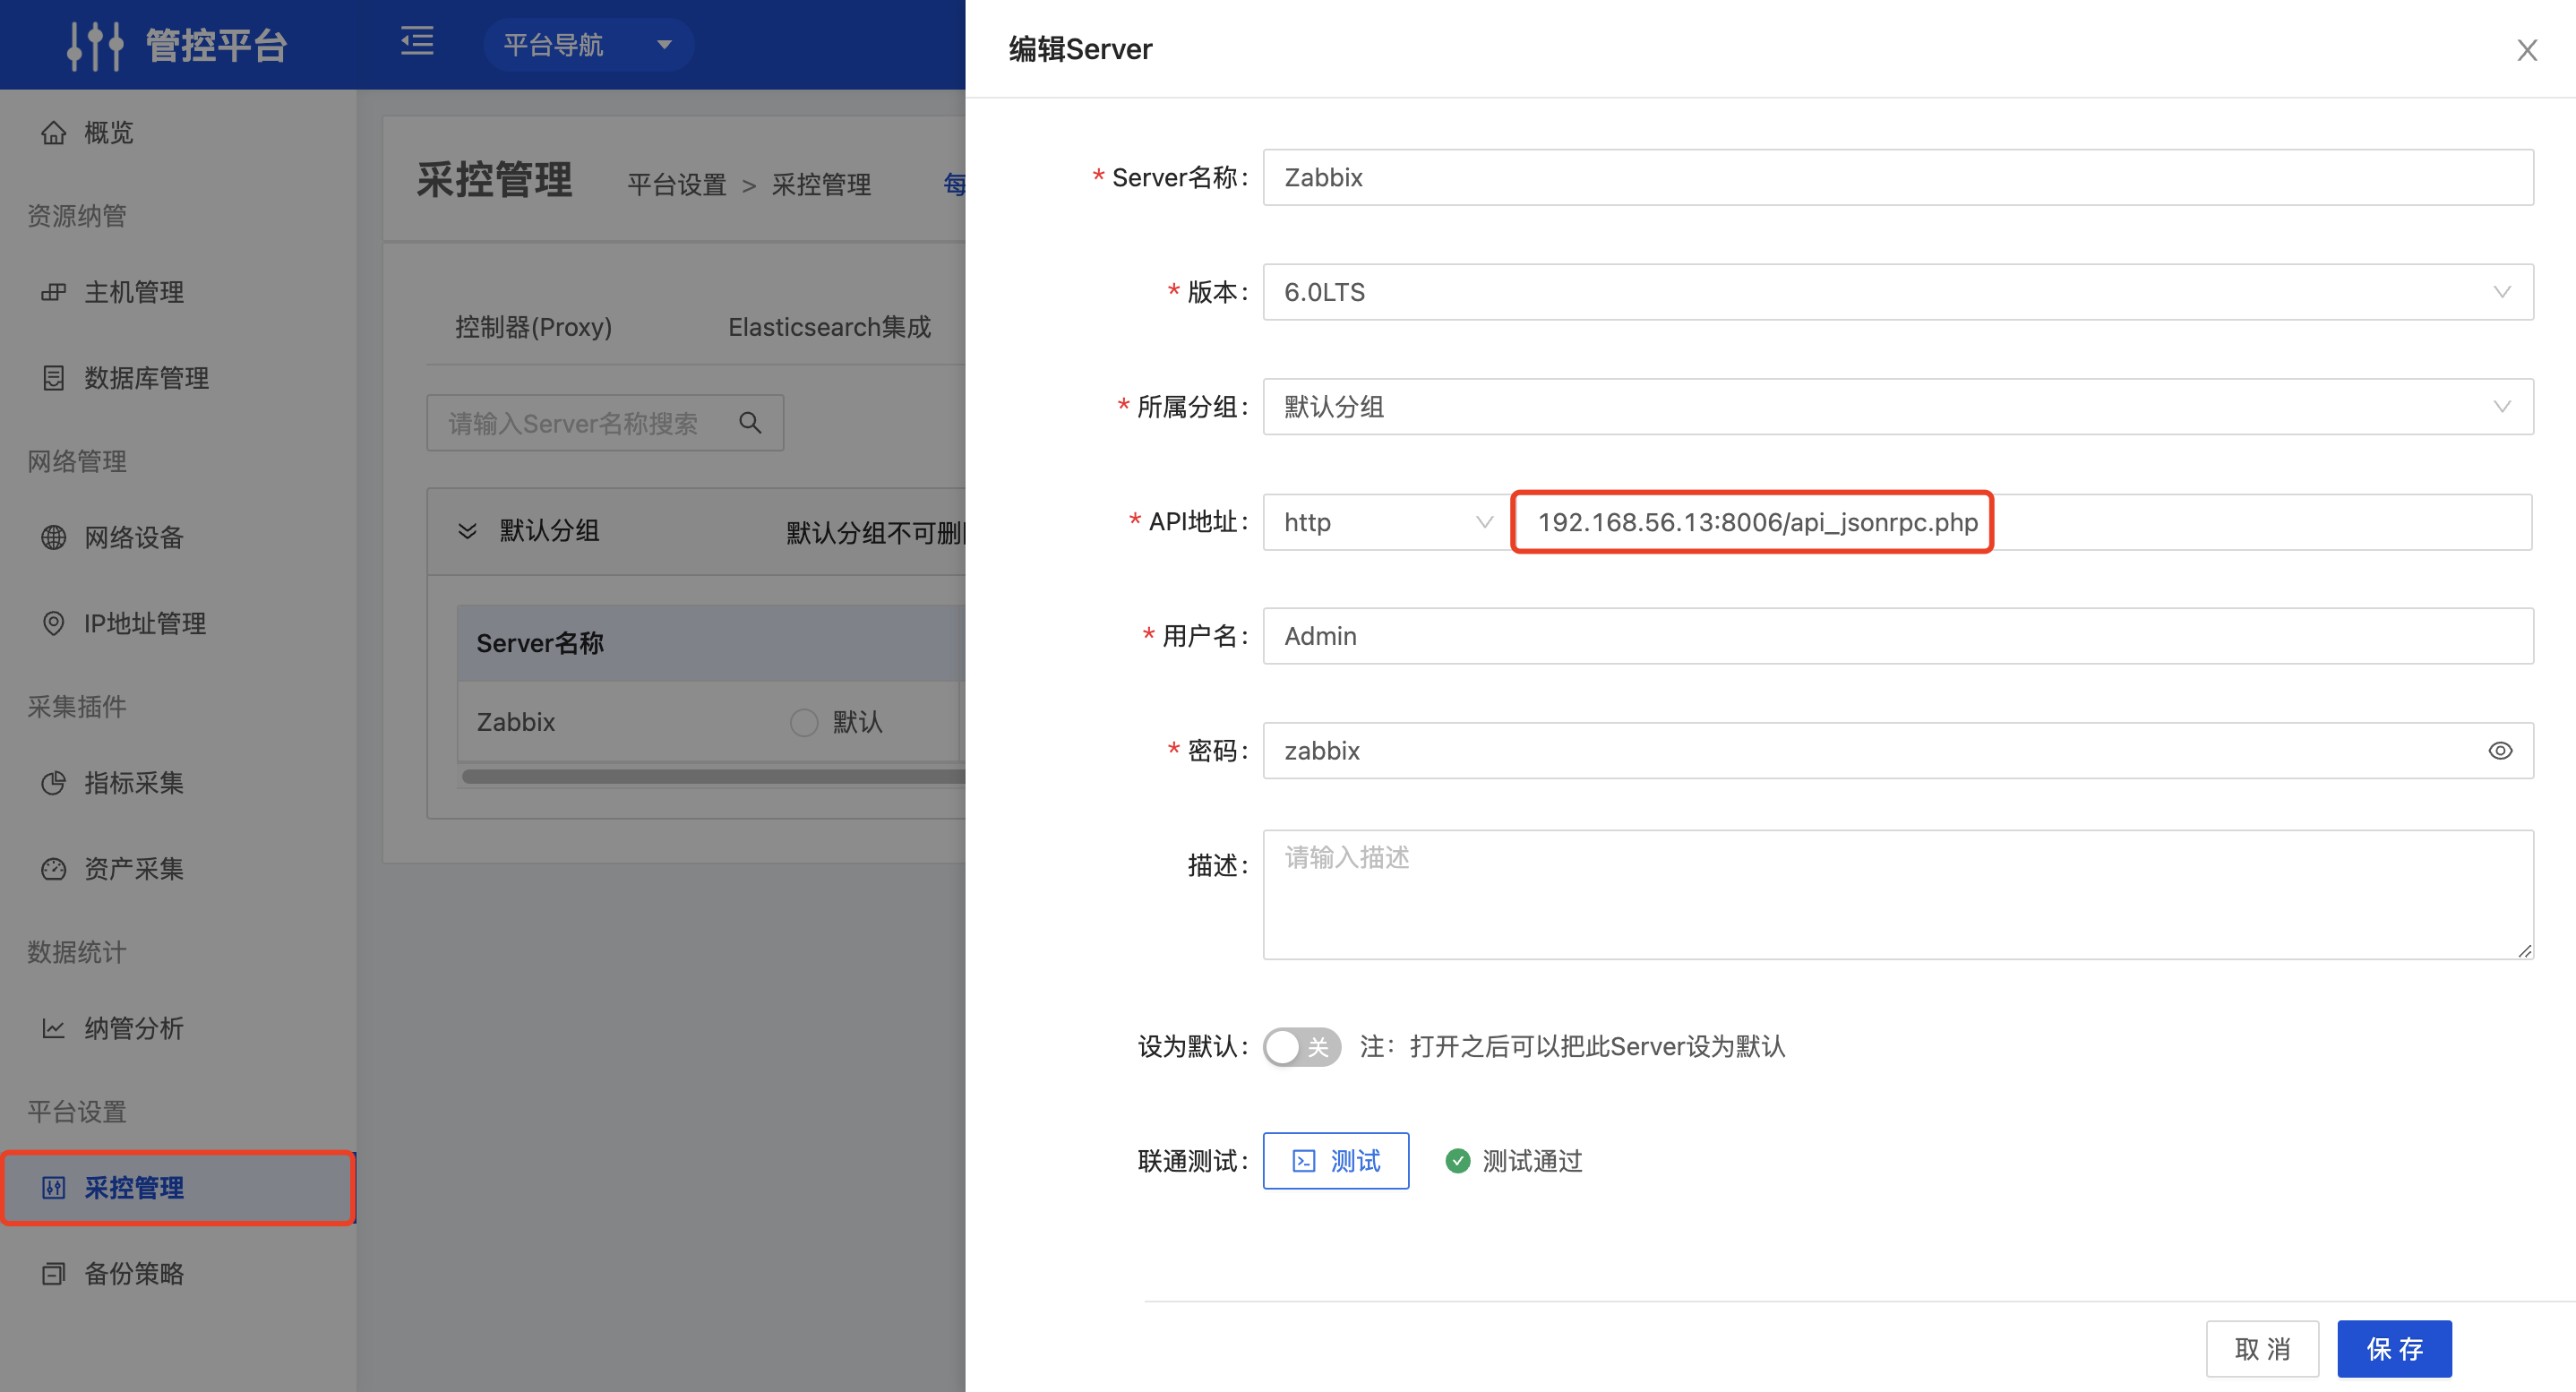
How Zabbix stays in sync with OpsAny
The Control Platform is OpsAny's underlying management channel; Zabbix synchronizes through it. Every host onboarded in the Control Platform can be synchronized to Zabbix, and the statistics views let you analyse monitoring coverage.
If Zabbix is reachable after deployment but you cannot log in with the password set in install.config, initialization most likely did not complete — try re-initializing.
Forwarding Zabbix alerts to OpsAny
Zabbix alerts can be configured to be sent to the Workbench; once configured, alarm media can be set up in the Workbench message subscriptions.
The script requires Python 3 and the requests==2.23.0 package.
Because OpsAny uses the official Zabbix image, runtime dependencies must be added manually to keep the setup standardized.
# Copy /opt/opsany-paas/saas/opsany_dispatch.py into the Zabbix Server at /usr/lib/zabbix/alertscripts
# (that path comes from the AlertScriptsPath setting in the Zabbix configuration) and make it executable.
docker cp opsany_dispatch.py opsany-zabbix-server-6.0.0:/usr/lib/zabbix/alertscripts/

# Install Python 3 and the dependencies
docker exec -it --user root opsany-zabbix-server-6.0.0 /bin/bash
chmod +x /usr/lib/zabbix/alertscripts/opsany_dispatch.py
apt update
apt install -y python3 python3-pip
pip3 install requests==2.32.3 --break-system-packages -i http://mirrors.aliyun.com/pypi/simple/ --trusted-host mirrors.aliyun.com
-
- Add a media type in Zabbix
Administration → Media types → Create media type.
New media type
#    Name: OpsAny
#    Type: Script
# Script name: opsany_dispatch.py
# Script parameters:
1. https://DOMAIN_NAME  # the domain name of your OpsAny deployment
2. workbench  # the Workbench application ID
3. 8c31c64e-5708-4f9f-a9e2-f38147931bad  # the Workbench SECRET_KEY (Developer Center - Built-in Applications - Workbench details)
4. {ALERT.SENDTO}  # recipient (OpsAny username configured as the media recipient)
5. {ALERT.SUBJECT}  # alert subject (message template subject of the media type)
6. {ALERT.MESSAGE}  # alert body (message template body of the media type)
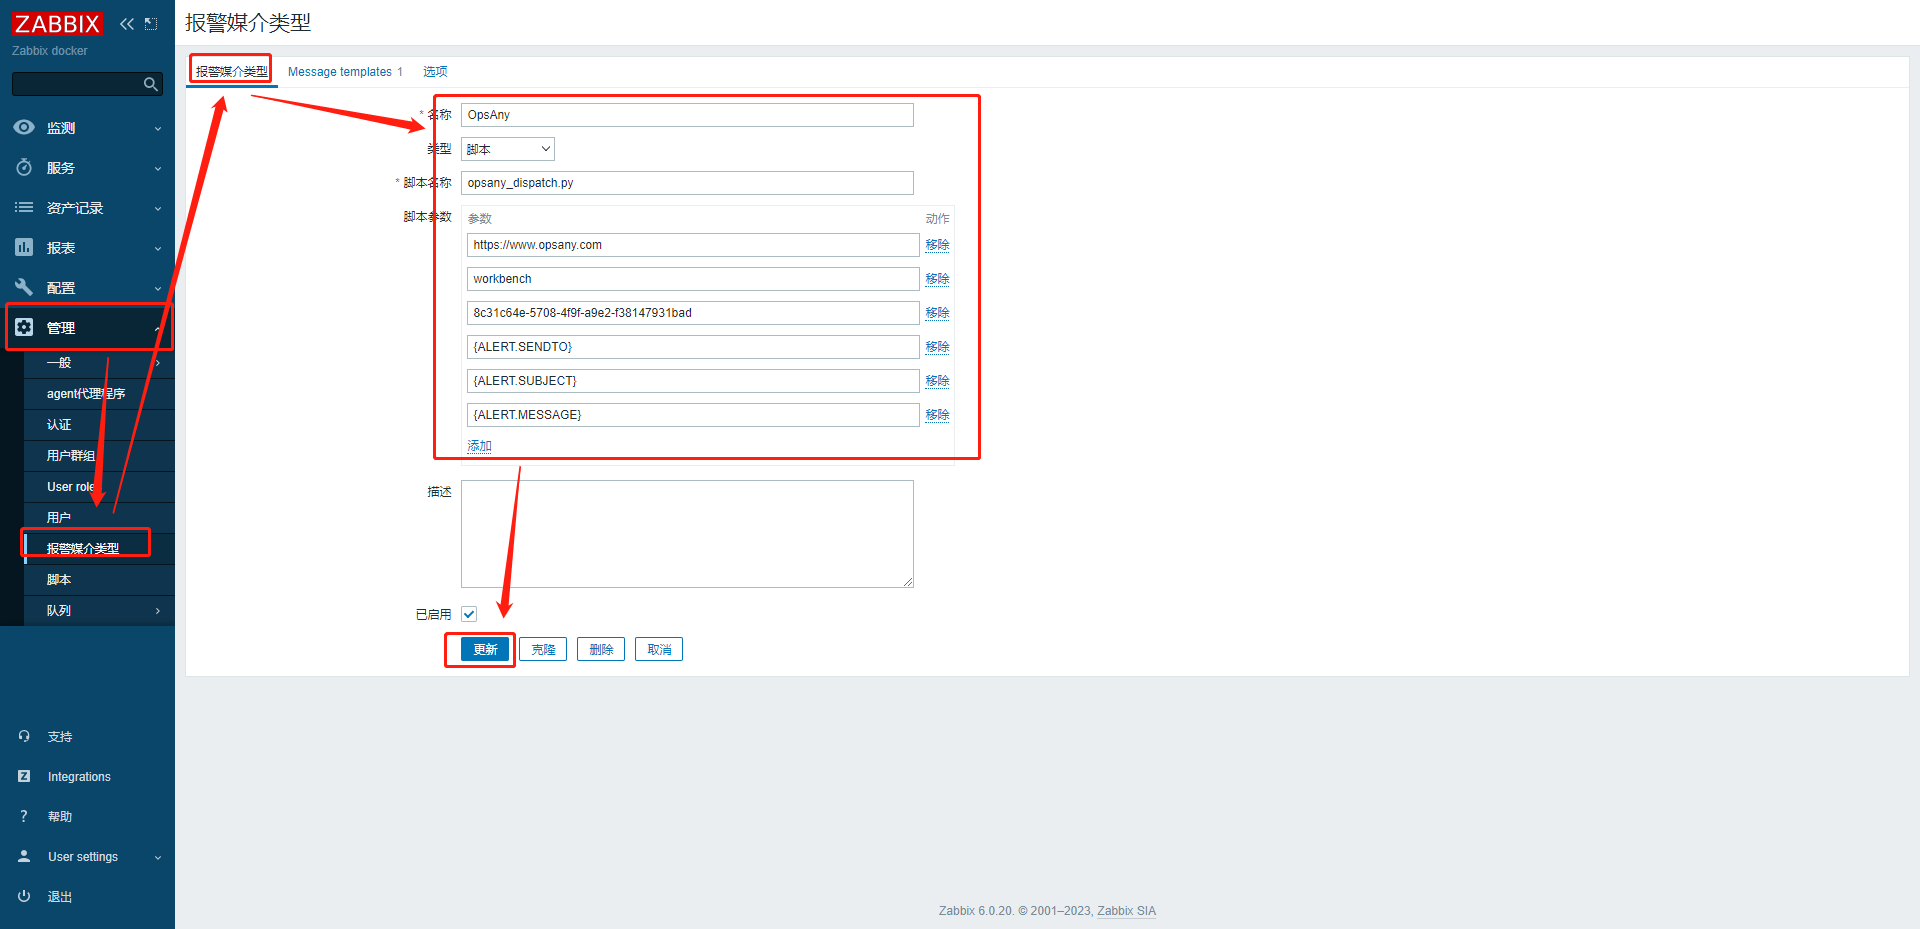
-
- Add a message template (subject and body are customisable)
Add a template
1. Select Message templates
2. Add
3. Fill in the message template
    Message type: Problem
    Subject: Host {HOST.NAME} has an alert {EVENT.NAME}
    Message:
Problem started at {EVENT.TIME} on {EVENT.DATE}
Problem name: {EVENT.NAME}
Host: {HOST.NAME}
Severity: {EVENT.SEVERITY}
Operational data: {EVENT.OPDATA}
Original problem ID: {EVENT.ID}
{TRIGGER.URL}
4. Update
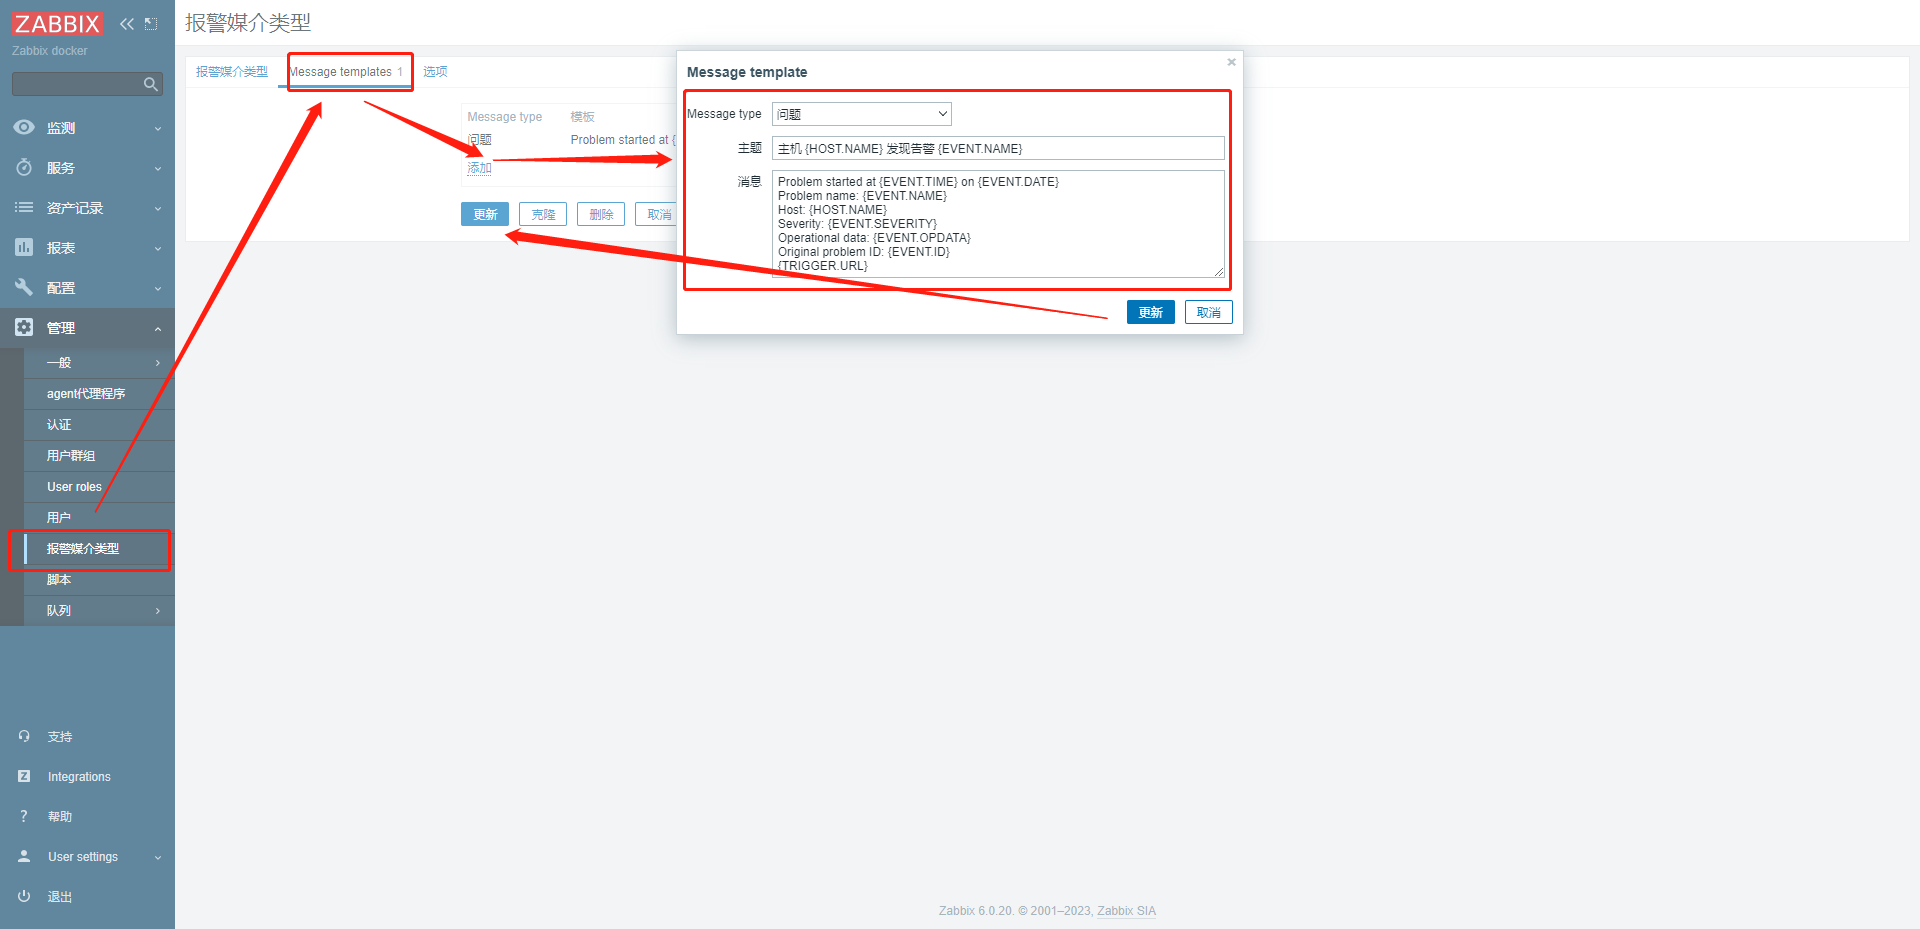
-
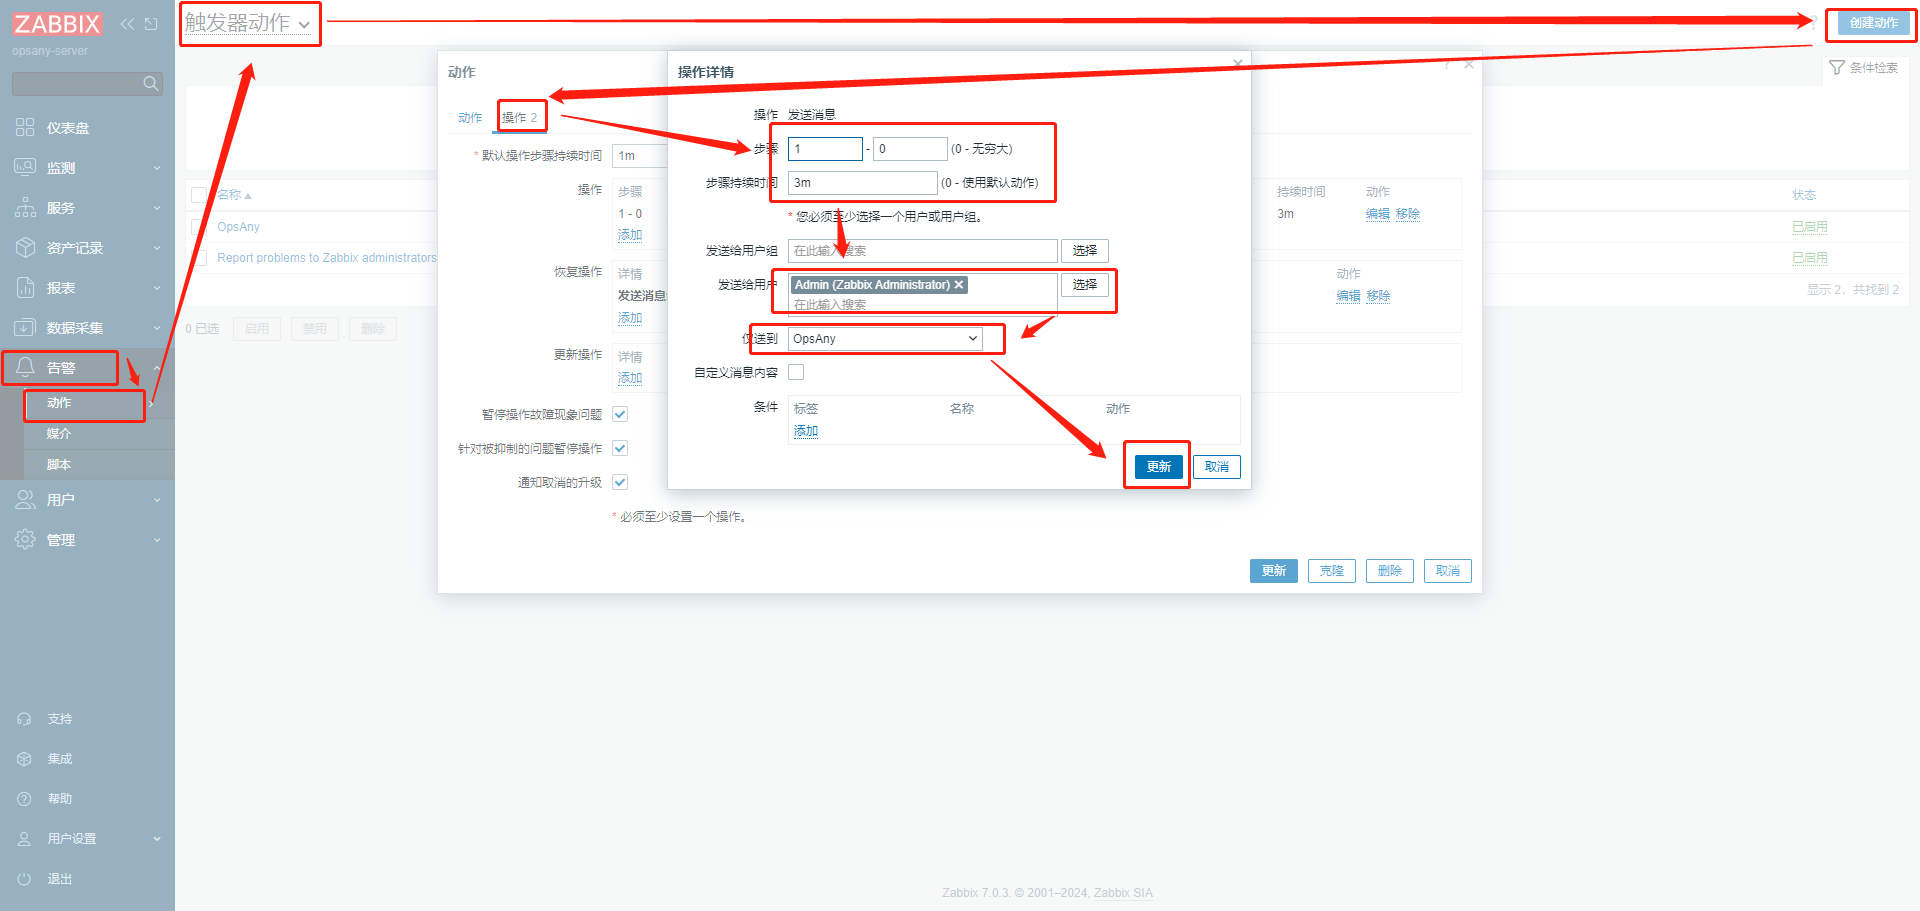
- Add an action in Zabbix
Configuration → Actions → Trigger actions → Create action
New action
Action:
    Name: OpsAny
Operations:
    Default operation step duration: 10m (customisable)
    Operations:
        Operation: Send message
        Steps: 1  0  (customisable)
        Step duration: 0  (customisable)
        Send to users: select users
        Send only to: OpsAny (the name configured for the media type)
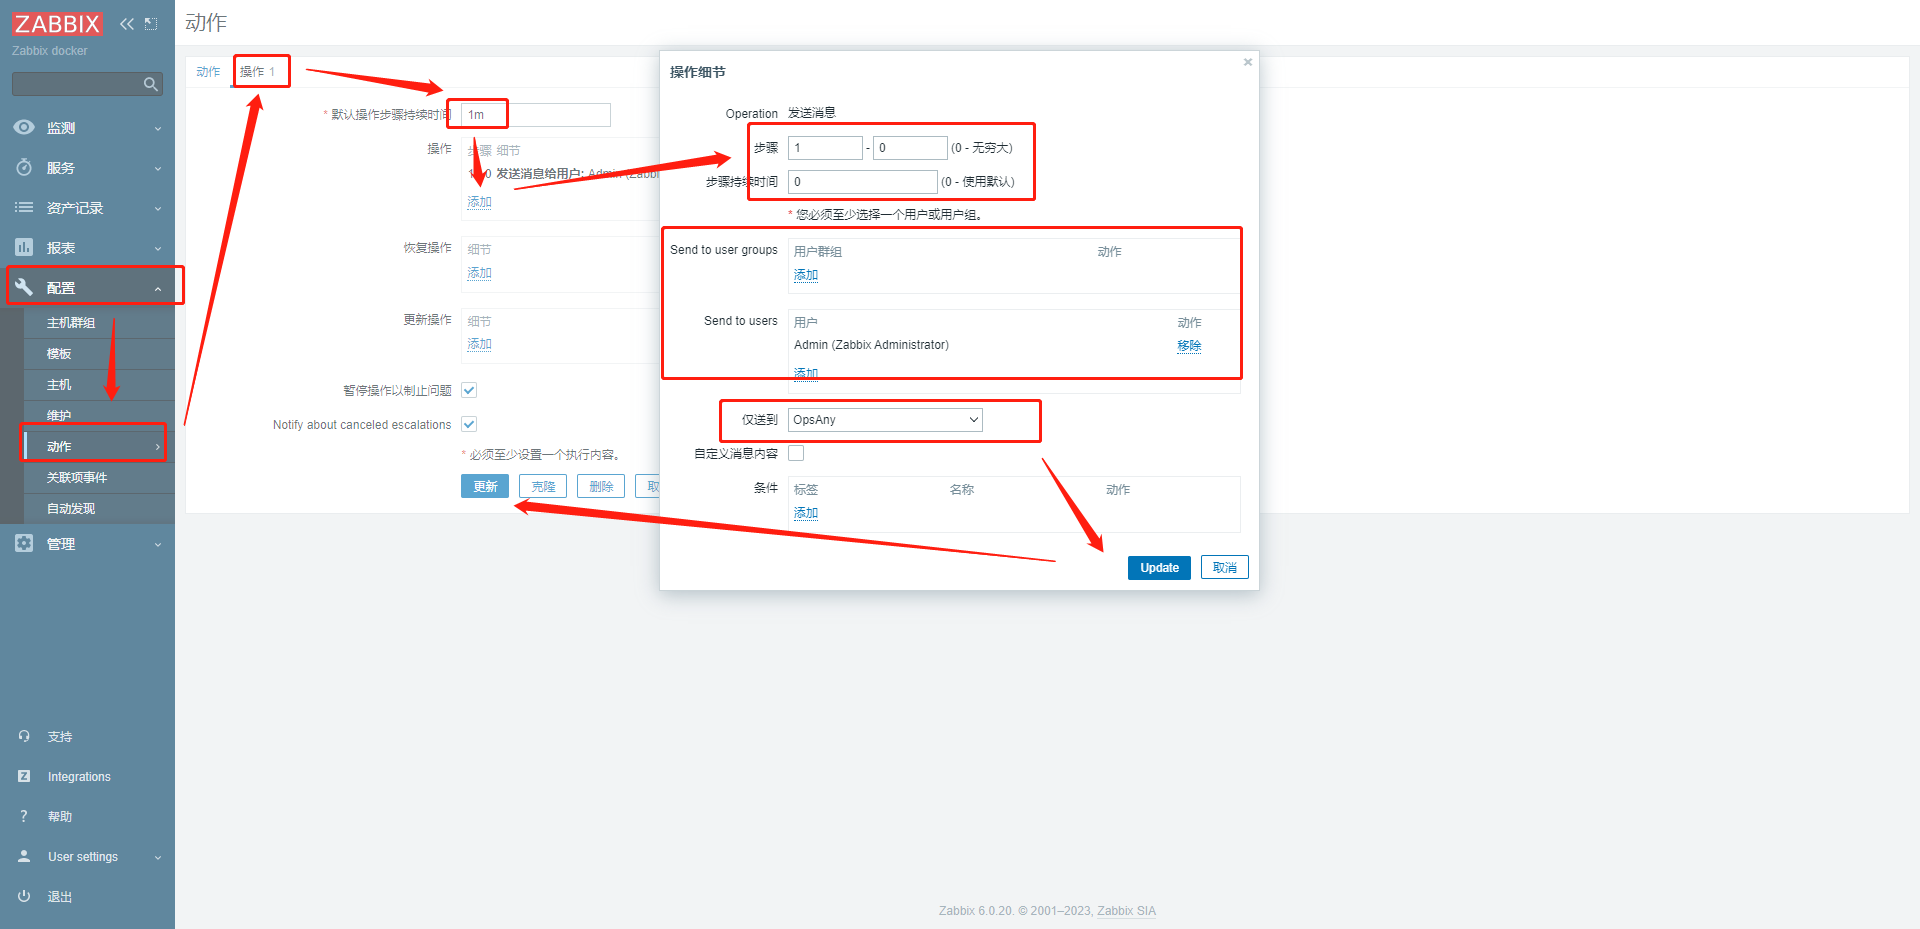
-
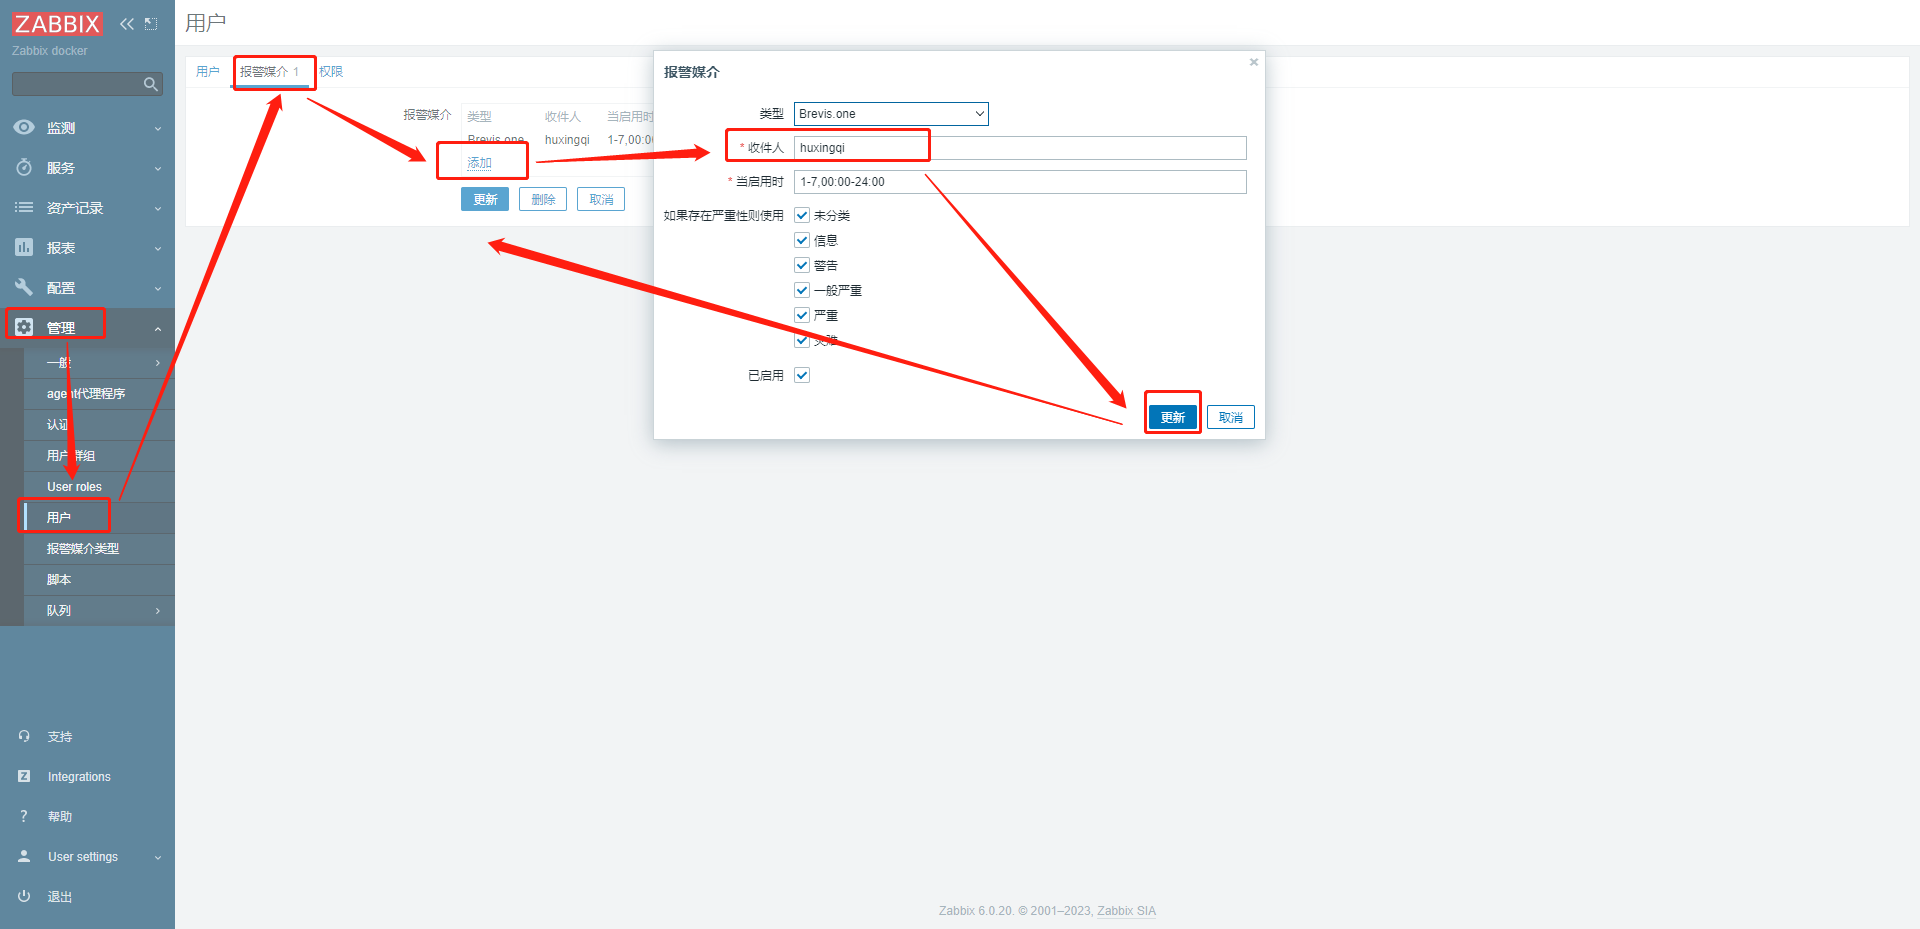
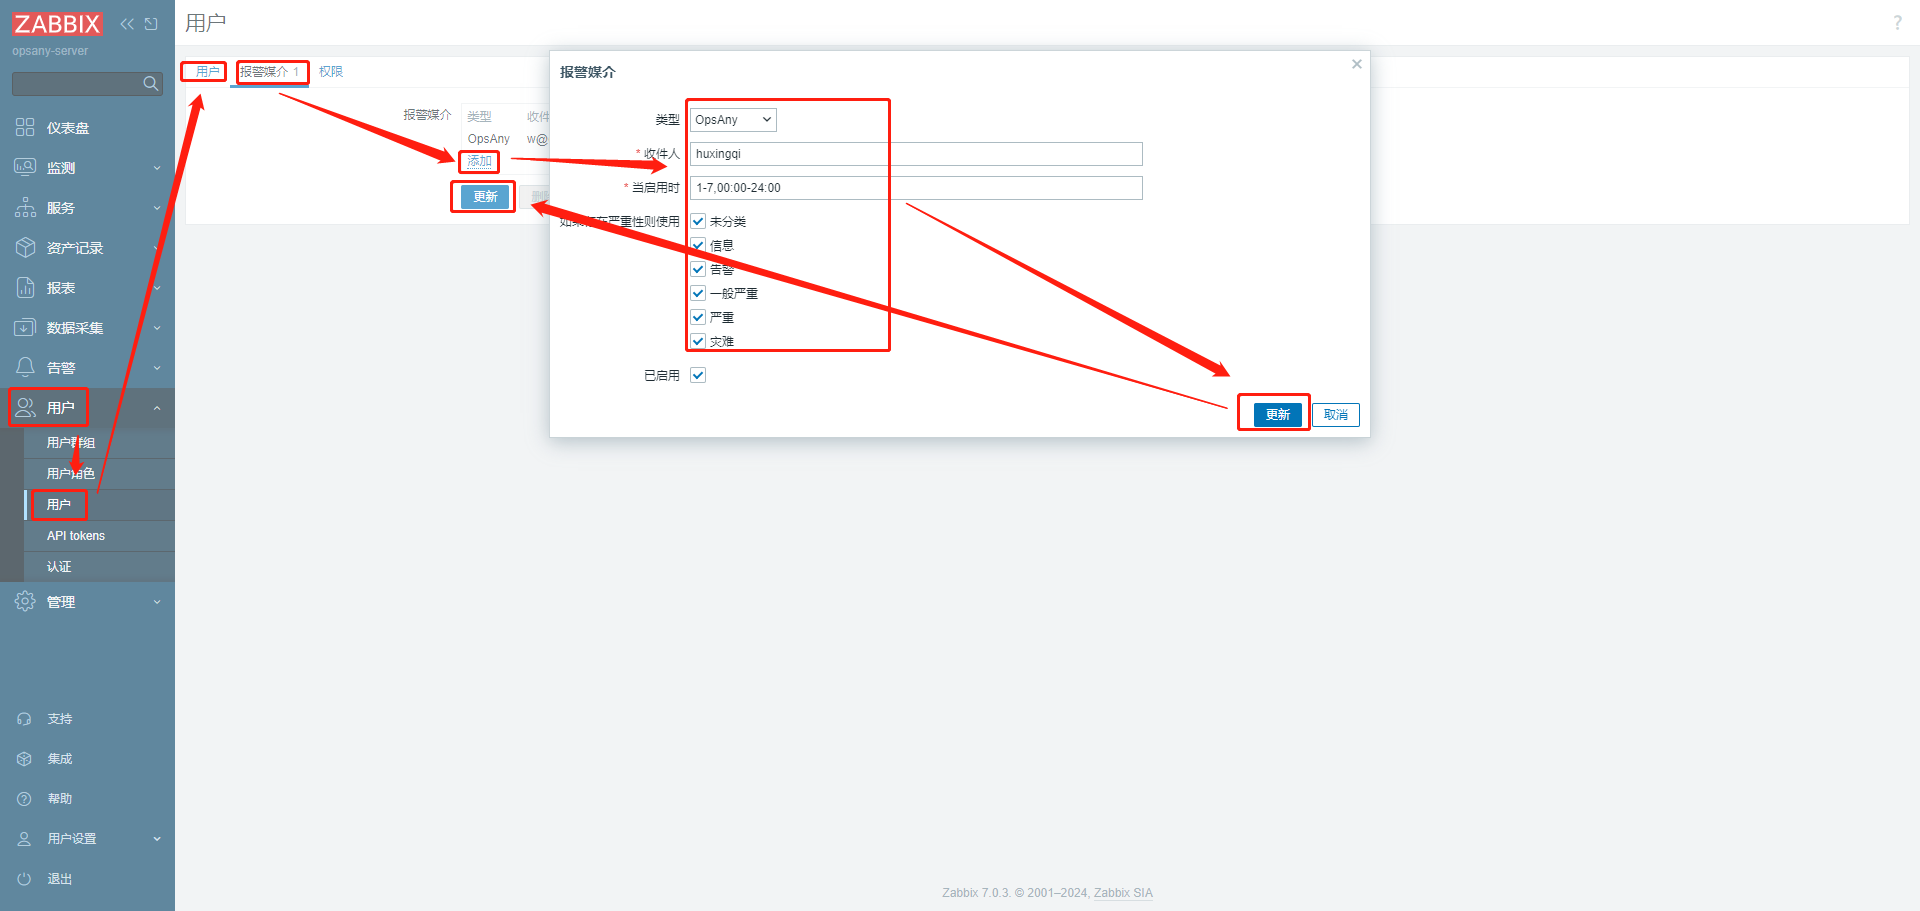
- Configure the user
Configure the media for the user
Media:
    Type: OpsAny (the name configured for the media type)
    Send to: OpsAny username (an error is raised if it does not exist)
    When active: 1-7,00:00-24:00  (customisable)
    Use if severity: select all (customisable)
    Enabled: checked
-
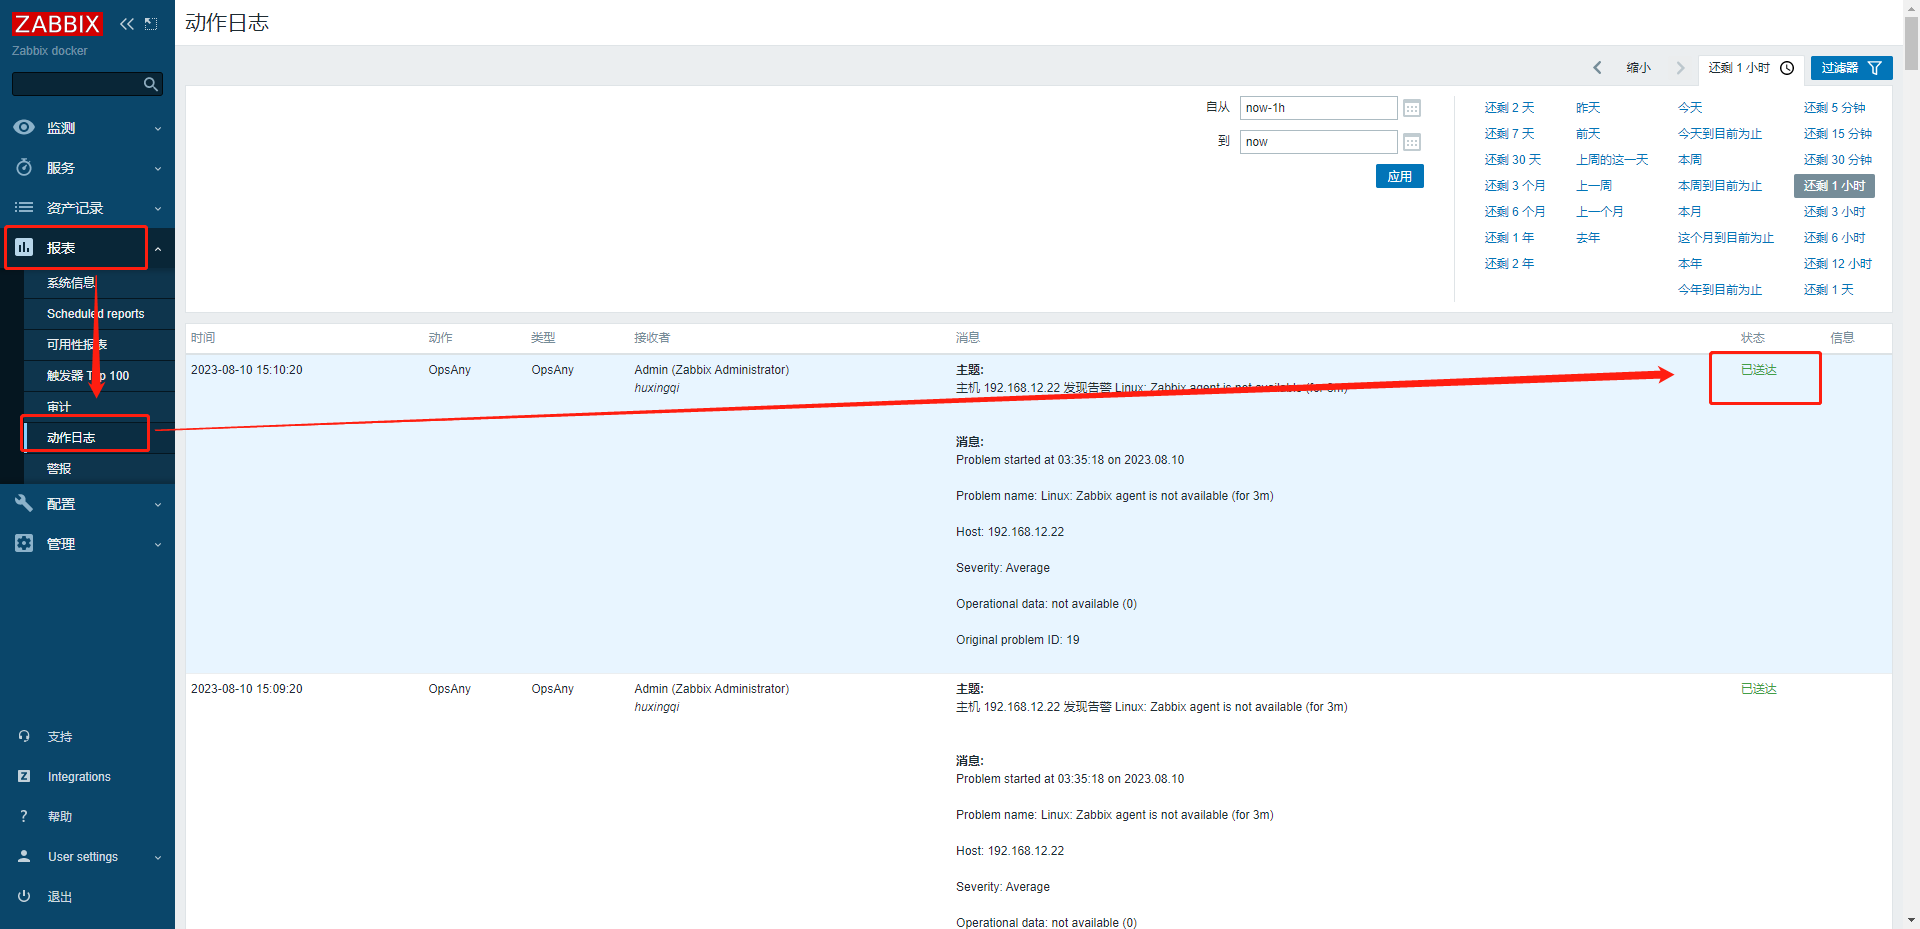
- Check the log
After configuring, check the action log for errors
# Copy /opt/opsany-paas/saas/opsany_dispatch.py into the Zabbix Server at /usr/lib/zabbix/alertscripts
# (that path comes from the AlertScriptsPath setting in the Zabbix configuration) and make it executable.
docker cp opsany_dispatch.py opsany-zabbix-server-7.0.3:/usr/lib/zabbix/alertscripts/

# Install Python 3 and the dependencies
docker exec -it --user root opsany-zabbix-server-7.0.3 /bin/bash
chmod +x /usr/lib/zabbix/alertscripts/opsany_dispatch.py
apt update
apt install -y python3 python3-pip
pip3 install requests==2.32.3 --break-system-packages -i http://mirrors.aliyun.com/pypi/simple/ --trusted-host mirrors.aliyun.com
-
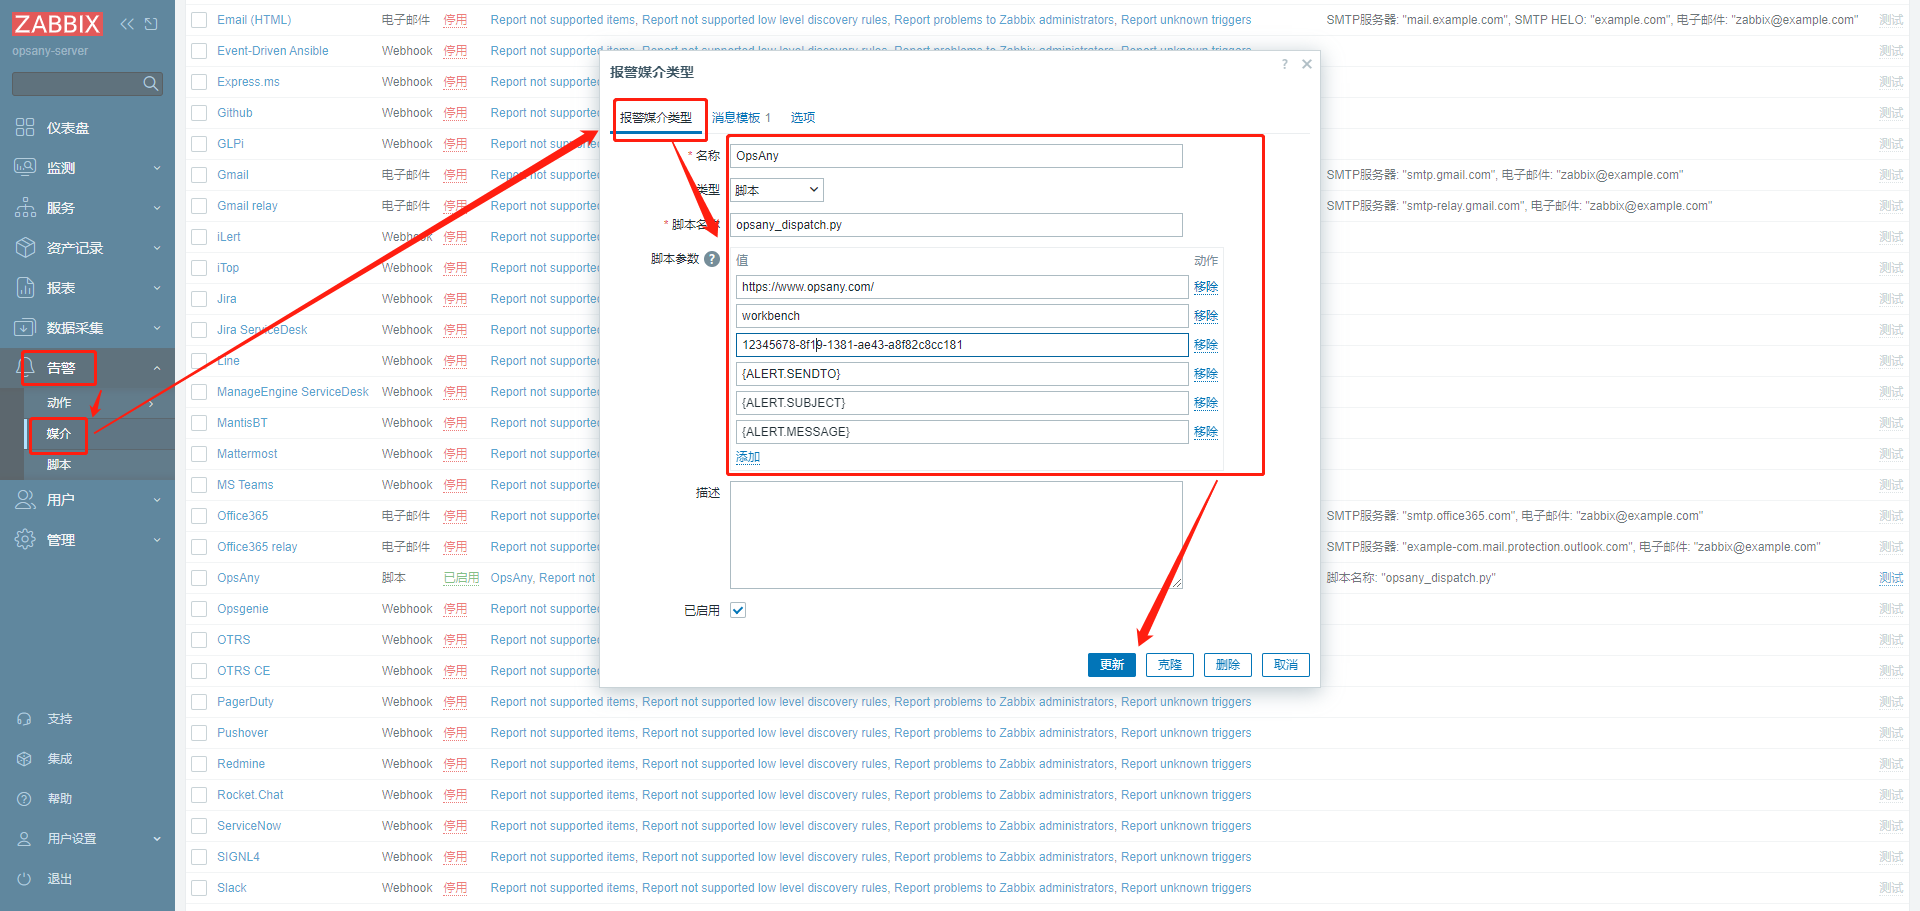
- Add a media type in Zabbix
Administration → Media types → Create media type.
New media type
#    Name: OpsAny
#    Type: Script
# Script name: opsany_dispatch.py
# Script parameters:
1. https://DOMAIN_NAME  # the domain name of your OpsAny deployment
2. workbench  # the Workbench application ID
3. 8c31c64e-5708-4f9f-a9e2-f38147931bad  # the Workbench SECRET_KEY (Developer Center - Built-in Applications - Workbench details)
4. {ALERT.SENDTO}  # recipient (OpsAny username configured as the media recipient)
5. {ALERT.SUBJECT}  # alert subject (message template subject of the media type)
6. {ALERT.MESSAGE}  # alert body (message template body of the media type)
-
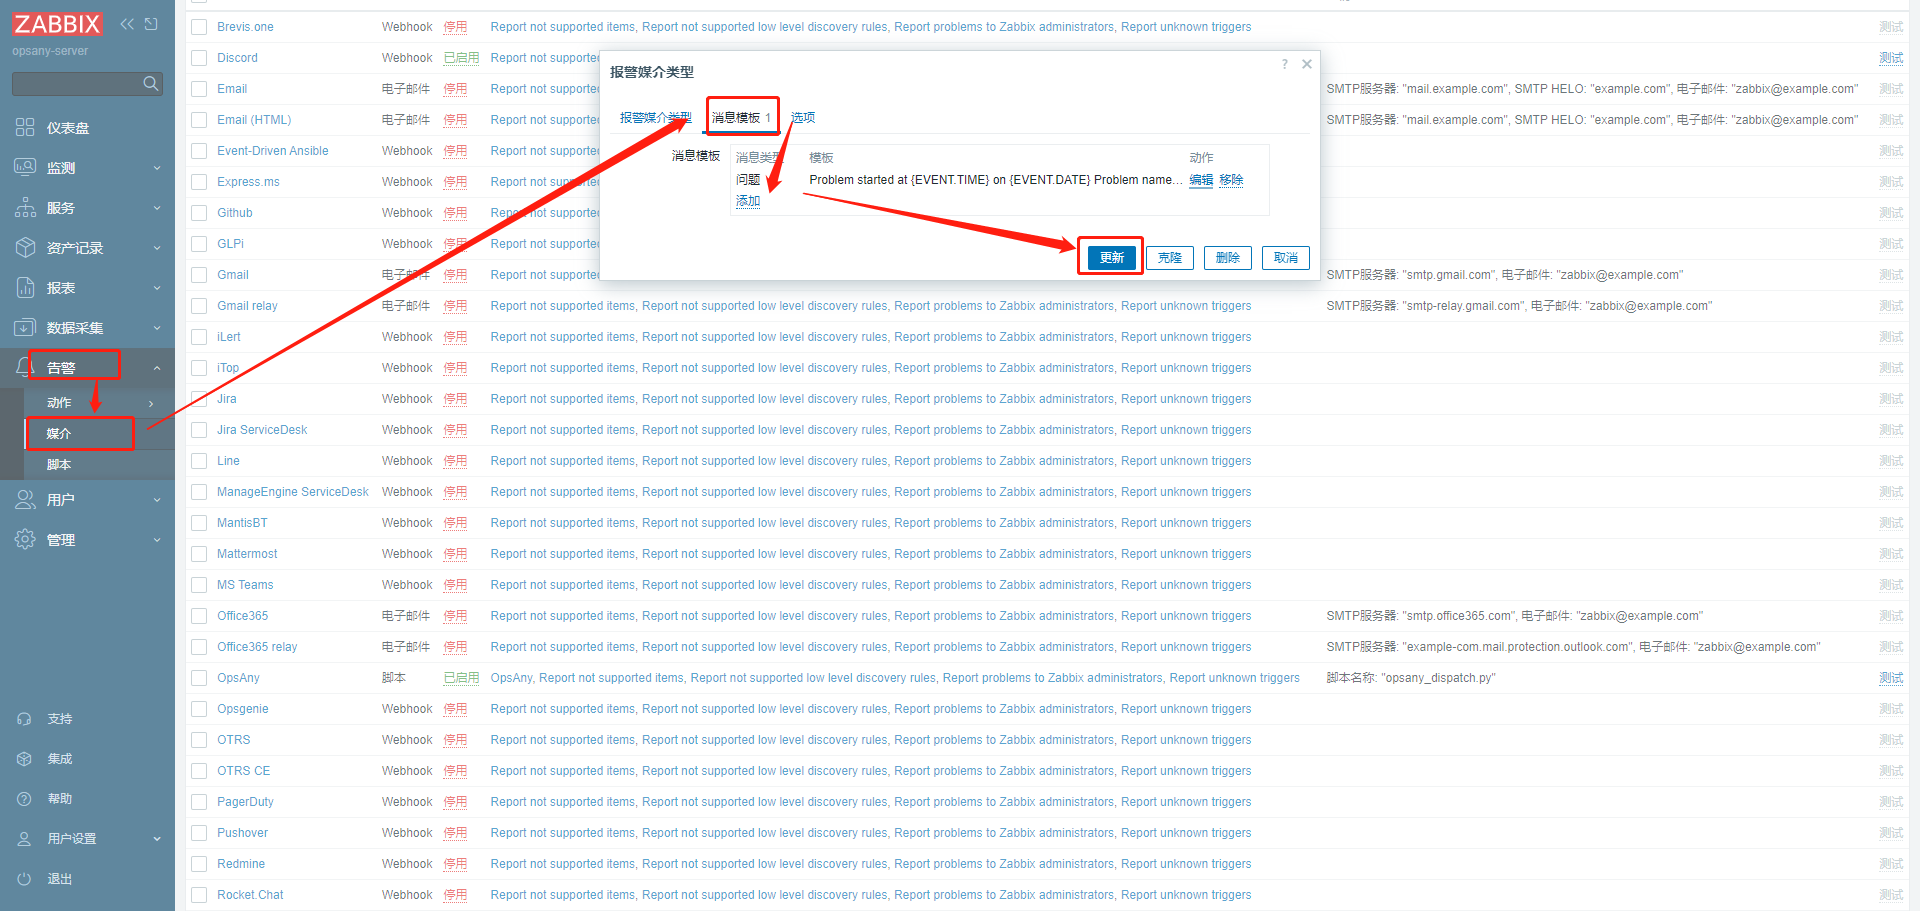
- Add a message template (subject and body are customisable)
Add a template
1. Select Message templates
2. Add
3. Fill in the message template
    Message type: Problem
    Subject: Host {HOST.NAME} has an alert {EVENT.NAME}
    Message:
Problem started at {EVENT.TIME} on {EVENT.DATE}
Problem name: {EVENT.NAME}
Host: {HOST.NAME}
Severity: {EVENT.SEVERITY}
Operational data: {EVENT.OPDATA}
Original problem ID: {EVENT.ID}
{TRIGGER.URL}
4. Update
-
- Add an action in Zabbix
Configuration → Actions → Trigger actions → Create action
New action
Action:
    Name: OpsAny
Operations:
    Default operation step duration: 10m (customisable)
    Operations:
        Operation: Send message
        Steps: 1  0  (customisable)
        Step duration: 0  (customisable)
        Send to users: select users
        Send only to: OpsAny (the name configured for the media type)
-
- Configure the user
Configure the media for the user
Media:
    Type: OpsAny (the name configured for the media type)
    Send to: OpsAny username (an error is raised if it does not exist)
    When active: 1-7,00:00-24:00  (customisable)
    Use if severity: select all (customisable)
    Enabled: checked
-
- Check the log
After configuring, check the action log for errors

Why not replace the Zabbix web UI?
OpsAny's philosophy is to embrace open source rather than to wrap it. We still recommend managing items and triggers directly in the Zabbix web UI. By integrating Zabbix, OpsAny fills Zabbix's gaps in asset management; through the Control Platform it fills the gaps in automated host onboarding and monitoring coverage. Zabbix itself is a very powerful enterprise monitoring tool and the one we recommend. The OpsAny team also provides Zabbix solution implementation and unofficial source-level support.
Integrating Prometheus
OpsAny Community Edition also supports Prometheus integration: when adding hosts in the Control Platform, they can be registered into a Prometheus Server automatically through Consul. To add an existing Prometheus instance to OpsAny, it must support Consul-based service discovery.
Deploying Prometheus from scratch
- Install Prometheus and Consul
Edit install.config and set the password of the Prometheus admin user. The default is PROM_SERVER_PASSWD="OpsAny@2020".
cd /opt/opsany-paas/install
source install.config
./prom-install.sh all
- Open Control Platform → (Collection Management) → Prometheus Integration → Add Server.
Example:
Prometheus:
    URL: http://192.168.56.11:9090    # default port is 9090
    Enable authentication
    Username: admin  # defaults to admin
    Password: OpsAny@2020   # read from install.config

Consul:
    URL: http://192.168.56.11:8500    # default port is 8500
    Enable authentication
    Token: xxx    # generated randomly during installation and stored in $INSTALL_PATH/conf/.consul_token

Alertmanager:
    URL: http://192.168.56.11:9093   # default port is 9093
    Enable authentication
    Username: admin  # defaults to admin
    Password:    # read from install.config
Once added, both the Prometheus and Consul statuses should be healthy, which means the integration succeeded.
Integrating an existing Prometheus
-
Identify the address of your Prometheus Server. If you do not have Consul, deploy it separately and integrate manually. You must wire Prometheus and Consul together yourself, and Consul must enable token authentication. You can refer to the Prometheus configuration used by OpsAny.
-
Open Control Platform → (Collection Management) → Prometheus Integration.
Example:
Prometheus URL
    URL: http://192.168.56.11:9090
    Username: admin
    Password: OpsAny@2020

Consul URL
    URL: http://192.168.56.11:8500
    Token: xxx
- Control Platform → Host Management → Configuration
You can now configure monitoring plugins under Host Management → Configuration and select the Prometheus Server you just integrated.
Viewing Prometheus metrics
Community Edition basic monitoring does not include Prometheus integration: hosts that use Prometheus monitoring plugins cannot be viewed in host monitoring. OpsAny bundles Grafana, and the visualization platform is a customized integration of Grafana. If you know Grafana, use the embedded Grafana in basic monitoring to do whatever you need.
You can also query data directly in the Prometheus web UI. For cloud hosts, remember to open port 9090 in the security group.